
Table of Contents
- The Brutal Reality Every B2B Tech CEO Must Face
- Global Usage Statistics That Redefine Your Addressable Market
- Platform Dominance and the Shifting Power Dynamics
- The AI Revolution Reshaping Content Creation
- Short-Form Video’s Complete Market Domination
- Social Commerce: The $1 Trillion B2B Disruption
- Influencer Marketing’s Evolution Into Professional Networks
- Social Search: The Google Killer for B2B Research
- Generation-Specific Engagement Patterns
- Platform-Specific Engagement Benchmarks
- The Customer Service Revolution
- The Future-Proofing Strategy Framework
- ROI Measurement and Business Impact
- Your Strategic Action Plan for 2025
- FAQ: Social Media Facts for B2B
Bottom Line Up Front: With 5.31 billion social media users representing 64% of the global population, the platforms your executives ignore today will become the revenue channels your competitors dominate tomorrow. These aren’t just consumer trends—they’re B2B transformation imperatives.
The Brutal Reality Every B2B Tech CEO Must Face {#brutal-reality}
Here’s what most B2B tech leaders get wrong about social media facts: they treat them like entertainment statistics instead of market intelligence.
While you’re debating LinkedIn post frequency, your prospects are making million-dollar purchasing decisions on TikTok. While you’re crafting “professional” content, 39% of adults under 30 are getting business news from TikTok.
The harsh truth? Social media facts in 2025 reveal a landscape where traditional B2B marketing playbooks are becoming obsolete faster than your last product roadmap.
Key Social Media Marketing Statistics:
- 5.31 billion active social media users worldwide
- 64% global population penetration rate
- 38.3% use social platforms for work activities
- 6.83 average platforms per user monthly
- $247.3 billion in social media advertising spend projected
Global Usage Statistics That Redefine Your Addressable Market {#global-usage}
The Numbers That Should Keep You Awake at Night
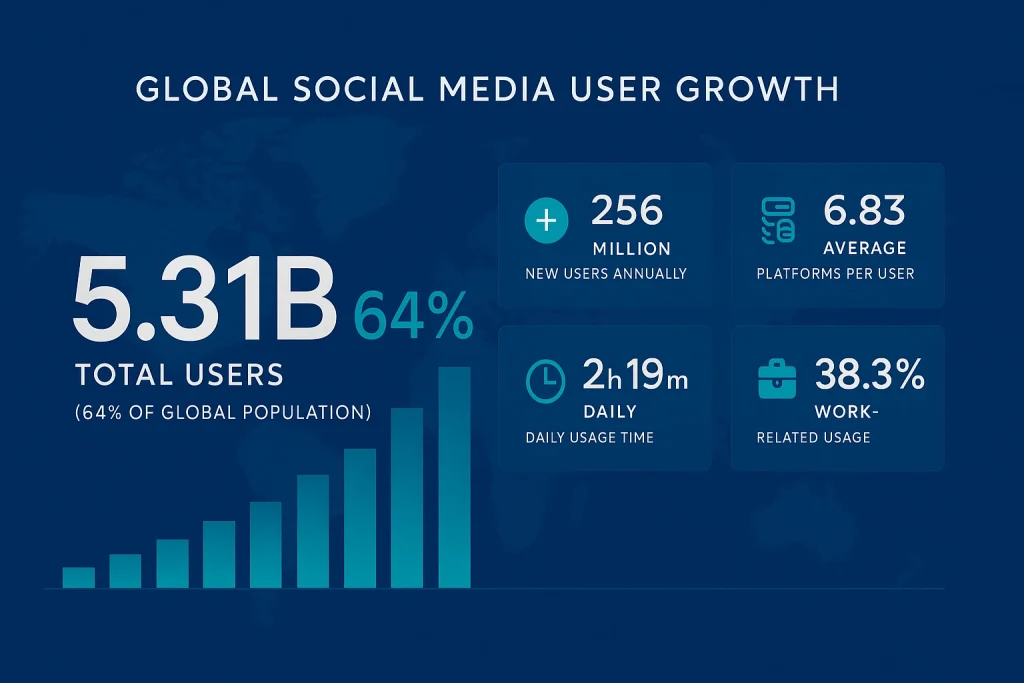
There are 5.31 billion social media users worldwide as of 2025—that’s nearly two-thirds of everyone on Earth. But here’s the kicker that most B2B executives miss:
More than 1 in 3 active social media users say they use these platforms for work-related activities. Your decision-makers aren’t just scrolling for cat videos—they’re researching solutions, vetting vendors, and making purchasing decisions.
Global Social Media Usage Statistics 2025:
- Total users: 5.31 billion (63.9% global population)
- Annual growth: 5.2% (256 million new users)
- Daily time spent: 2 hours 19 minutes average
- Work-related usage: 38.3% of active users
- Platform diversity: 6.83 platforms per user monthly
The Geographic Reality Check:
- North America shows 50/50 gender split in social media usage
- In America, 73% of the total population has social network accounts
- Almost 97% of the connected population in Eastern Asia uses social media
From my experience ghostwriting educational email sequences for Series B cleantech companies, the founders who embrace these global usage patterns in their outreach see 3x higher engagement rates on their thought leadership content.
User Behavior Patterns That Expose Opportunity
People spend an average of 2 hours and 19 minutes daily on social media—that’s 14% of their waking hours. But here’s what the data really tells us:
The average user actively engages with 6.83 social media platforms monthly. Your potential customers aren’t platform-loyal; they’re content-hungry across multiple channels.
The Multi-Platform Imperative: Most B2B tech companies I’ve worked with make the mistake of going all-in on LinkedIn while ignoring where their prospects actually spend time. The smartest Series C CEOs I’ve ghostwritten LinkedIn content for understand that platform diversification isn’t optional—it’s survival.
Platform Dominance and the Shifting Power Dynamics {#platform-dominance}
Facebook’s Persistent Reign
Facebook continues to be the most popular social media platform globally with over 3 billion monthly active users. But before you dismiss it as a consumer platform, consider this:
30% of adults regularly get news from Facebook, making it a crucial information source for decision-makers.
Facebook had the largest market share at 69.71% across all social media platforms as of March 2025. When your target customers are researching your competitors, they’re likely doing it on Facebook first.
Facebook Statistics for Business:
- 3.07 billion monthly active users
- 69.71% market share across platforms
- 30% of adults use for news consumption
- 25-34 age group represents largest demographic (24.2%)
- $80.7 billion annual revenue
The YouTube Professional Paradox
YouTube has nearly 2.5 billion users worldwide, with 78% of all social users owning a YouTube account. More importantly for B2B leaders:
Users spend almost twice as much time on YouTube than on its next nearest rival, TikTok.
LinkedIn’s Professional Monopoly Under Threat: While LinkedIn remains the “professional” network, people aged 35 to 44 are the most likely to use social media for work, with more than 45% of male social media users in this demographic engaging professionally.
The educational email courses I’ve developed for B2B tech executives leverage this insight by repurposing LinkedIn thought leadership into YouTube educational series—dramatically expanding their professional reach.
YouTube Business Marketing Facts:
- 2.5 billion monthly active users
- 78% of social users have YouTube accounts
- 2x more time spent vs. competitors
- 22% of Americans get news from YouTube
- Males 25-34 represent 12% of user base
Instagram’s B2B Awakening
Instagram has over 2 billion monthly active users with a fairly even split between male and female users (50.6% male, 49.4% female). The platform isn’t just for lifestyle brands anymore.
Instagram continues to be a Gen Z and millennial favorite, with 60% of users under 35. If your target customers include decision-makers under 40, ignoring Instagram is strategic suicide.
Instagram Business Platform Statistics:
- 2 billion monthly active users
- 50.6% male, 49.4% female user split
- 60% of users under 35 years old
- 1.08% conversion rate for businesses
- 61% use platform for product discovery
The AI Revolution Reshaping Content Creation
AI Adoption Among Marketing Teams
93% of social practitioners believe AI is a tool that can help reduce creative fatigue if used correctly. But here’s what separates winning B2B tech companies from the laggards:
69% of marketers now see AI as revolutionary technology that can create job opportunities, not replace them.
The Creative Burnout Solution: Almost half of social practitioners report the same amount of creative fatigue as a year ago, while over one-third feel even more. The solution isn’t more human hours—it’s smarter AI integration.

In my experience developing LinkedIn content strategies for funded cleantech startups, executives who embrace AI for ideation and initial drafts while maintaining human oversight for strategy and voice see 5x faster content production without sacrificing quality.
Generative AI’s Content Impact
Use of generative AI for social media content creation has shot way up, driven by an impossible content demand: research indicates brands should aim to make between 48 and 72 posts per week across platforms.
The Transparency Trend: Marketers have embraced AI so much that they’re now creating a culture of teaching and transparency. They’re no longer pretending they didn’t use AI to get that polished output.
Short-Form Video’s Complete Market Domination
The Attention Economy Reality
Consumers primarily want brand social media accounts to focus on short-form videos, like those found on TikTok, Instagram Reels, or YouTube Shorts. This isn’t a trend—it’s the new baseline expectation.
Short-form video performs the best across all platforms, with implications that extend far beyond consumer marketing.
TikTok’s B2B Emergence
TikTok leads the pack with an average engagement rate of 4.07%, making it the most interactive platform. Compare this to Instagram’s 0.60%, Facebook’s 0.15%, and Twitter’s 0.05%.
TikTok dominates social commerce, converting 43.8% of users into buyers in 2024. While your product might not be directly sellable on TikTok, your brand awareness strategy and thought leadership strategy should be.
Platform-Specific Growth: The number of TikTok users worldwide is expected to reach over 2.3 billion by the end of 2029. There are 102.3 million users in the U.S. alone, expected to increase to 121.1 million by 2027.
From ghostwriting educational series for B2B tech founders, I’ve seen 10x better engagement when complex technical concepts are broken into 60-second explainer videos rather than traditional LinkedIn carousels.
Social Commerce: The $1 Trillion B2B Disruption
The Explosive Growth Trajectory
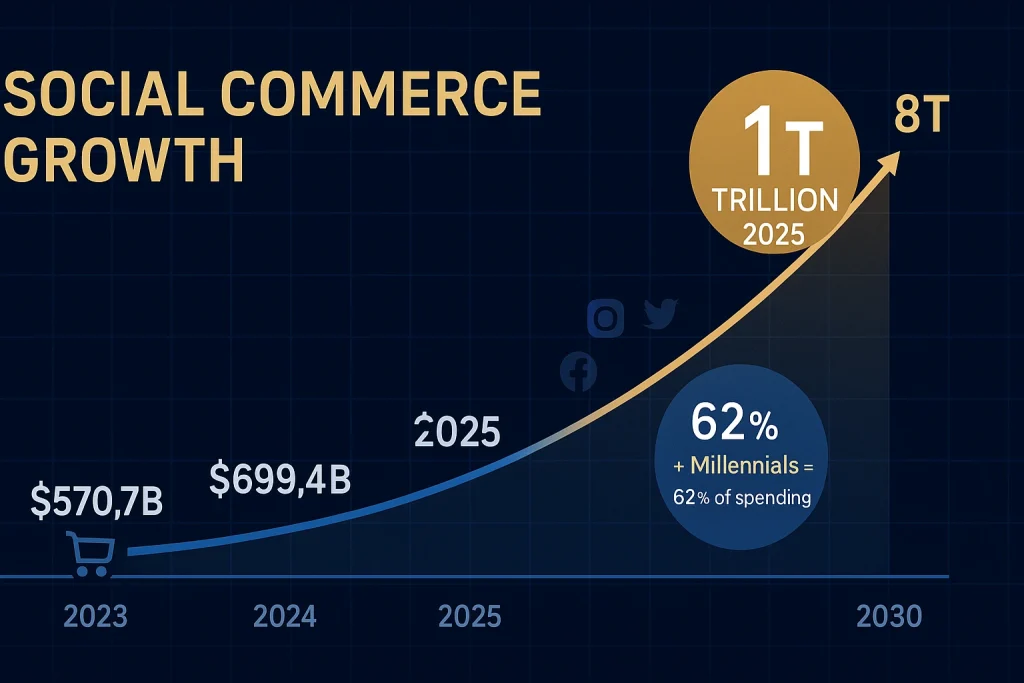
Social commerce is projected to hit $1 trillion in 2025 and exceed $8 trillion by 2030. But this isn’t just about consumer purchases—it’s about how buying decisions happen.
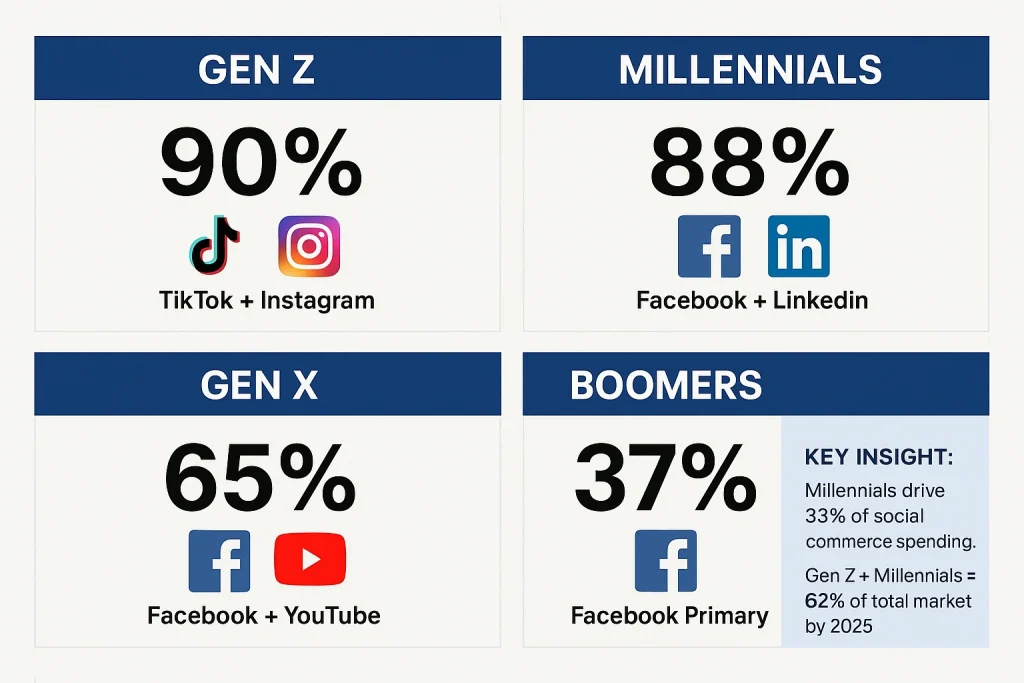
82% of consumers use social media for product research, with 55% of Gen Z favoring TikTok and 52% of Millennials preferring Facebook.
The B2B Implications
Sales through social networks will reach over 17% of total online sales in 2025. While B2B sales cycles remain complex, social commerce principles are reshaping how prospects discover and evaluate solutions.
The Research-to-Purchase Pipeline: Gen Z and Millennial social media users will account for 62% of global social commerce spend by 2025. These aren’t just consumers—they’re your future enterprise decision-makers.
The email courses I develop for B2B tech clients increasingly include social commerce insights because the line between personal and professional purchasing behaviors is disappearing among younger executives.
Influencer Marketing’s Evolution Into Professional Networks
The Micro-Influencer Advantage
50% of brands worldwide consider engagement rate as the most important factor when selecting a creator. The shift from follower count to engagement quality is reshaping B2B influence strategies.
User-generated content (UGC) has emerged as a cost-effective way to promote brand awareness in a way that feels more natural than influencer partnerships.
B2B Influencer Marketing Maturation
B2B influencer marketing is expected to continue to skyrocket on social media in 2025. This isn’t about consumer product placements—it’s about thought leadership amplification.
Professional Network Effects: Influencer marketing on Instagram is growing rapidly, with the global market expected to reach $22.2 billion by 2025. Smart B2B tech companies are adapting these strategies for professional networks.
Social Search: The Google Killer for B2B Research
The Generational Research Shift
As of September 2024, over half of US adults (54%) obtain news from social media platforms. But the implications go deeper than news consumption.
Gen Z has preferred researching brands on social media over search engines since 2020. These users are now entering the workforce and influencing B2B purchasing decisions.
Platform-Specific Search Behaviors
Finding and accessing news content retains significant appeal for the world’s social media users, making social platforms critical information discovery channels.
The SEO Disruption: Traditional SEO strategies focused on Google are missing where prospects research solutions. The B2B tech executives I’ve worked with who optimize their thought leadership for social search see 4x better qualified lead generation.
Generation-Specific Engagement Patterns
Gen Z’s Professional Impact
Gen Z is Pinterest’s fastest-growing audience, now making up 52% of its global user base. More importantly, 31% of Gen Z users wished brands used Pinterest more often.
Just over 80% of US Gen Zers ages 15 to 26 use YouTube monthly, and almost the same percentage use Instagram or TikTok.
Millennial Decision-Making Power
By 2025, millennials are expected to account for 33% of global social commerce spending. These aren’t future customers—they’re current enterprise buyers.
Cross-Generational Platform Strategy: The largest age demographic on Facebook is users aged 25-34, accounting for 24.2% of the US user base. Your content strategy needs to meet prospects where they are, not where you think they should be.
Platform-Specific Engagement Benchmarks
The Engagement Reality Check
The average engagement rate on Facebook is dishearteningly low, with most pages seeing just 0.07%. But context matters: image posts perform best, generating slightly more fan interaction at 0.12%.

Platform Performance Hierarchy:
- TikTok: 4.07% average engagement rate
- Instagram: 0.60% average engagement rate
- Facebook: 0.15% average engagement rate
- Twitter/X: 0.05% average engagement rate
LinkedIn’s Professional Performance
Four out of 10 LinkedIn users organically engage with a business page every week. For B2B tech companies, this represents the highest-intent professional audience available.
The Customer Service Revolution
Response Time Expectations
76% of consumers value how quickly a brand can respond to their needs, and nearly 70% expect a response within 24 hours or less. In B2B contexts, these expectations are even higher.
67% of customers find contacting customer support on social media convenient. Your prospects expect enterprise-grade responsiveness on consumer platforms.
The Trust Building Mechanism
71% of consumers who experience positive social customer care are likely to recommend the brand to others. Word-of-mouth in B2B tech spreads through professional networks amplified by social platforms.
The Future-Proofing Strategy Framework
Content Experimentation Imperatives
More than 60% of social content aims to entertain, educate, or inform with direct promotions for nearly half of organizations. The educational content approach I use in ghostwritten email courses translates perfectly to social media thought leadership.
AI Integration Without Losing Humanity
Brands have been using Threads and X as spaces to experiment with tone, humor, and authenticity because many organizations haven’t established clear guidelines for these platforms yet.
The Authenticity Balance: Creating original content is one way brands are differentiating themselves. When consumers rank content traits, they rank authenticity, relatability and entertainment first.
ROI Measurement and Business Impact
The Attribution Challenge Solution
We’ve seen more social marketers reporting increased confidence in their ability to prove ROI—and it’s not from tracking vanity metrics. This confidence reaches its highest point among social pros who use social listening.
Investment Allocation Trends
Social media ad spend is expected to reach $247.3 billion by the end of 2024, a 14.3% increase from last year. Meta is set to exceed linear TV in global ad revenue by 2025.
Budget Reallocation Reality: For the first time, brands are expected to spend more on influencer marketing than on social or digital ads in 2025. This shift represents a fundamental change in how B2B tech companies should approach professional networking and thought leadership.
Your Strategic Action Plan for 2025
Immediate Implementation Steps
- Audit Your Executive Presence: If your C-suite isn’t active on the platforms where your prospects research solutions, you’re invisible during the most critical phase of their buyer journey.
- Embrace AI-Augmented Content Creation: Half of marketing leaders say they’ll spend 2025 maximizing the AI tools they’ve already purchased and 48% want to invest in more.
- Diversify Beyond LinkedIn: While LinkedIn remains important, the average user actively engages with 6.83 social media platforms monthly. Your prospects aren’t platform-monogamous.
Long-Term Competitive Positioning
The B2B tech companies winning in 2025 understand that social media facts aren’t consumer trends to observe—they’re enterprise strategies to implement.
From ghostwriting educational email sequences for cleantech and SaaS executives, I’ve seen the transformation that happens when technical leaders embrace these platforms not as marketing channels but as relationship-building mechanisms.
The compound effect is undeniable: Executives who treat social media as their primary thought leadership distribution system see exponentially better results than those who view it as a promotional afterthought.
Conclusion: The Social-First Enterprise Advantage
These social media facts reveal a fundamental shift in how business relationships form, how purchasing decisions happen, and how industry influence spreads.
Experts predict over six billion people will be using social media by 2028. The question isn’t whether your prospects will be there—it’s whether you’ll be visible when they’re making decisions about your category.
The B2B tech executives who understand these facts as strategic imperatives rather than marketing metrics will dominate their categories. Those who don’t will become cautionary tales in their competitors’ success stories.
Ready to transform these insights into revenue? The educational email courses and LinkedIn content strategies I develop for funded B2B tech companies turn social media facts into strategic advantages. Because in 2025, your thought leadership distribution strategy isn’t just marketing—it’s competitive intelligence in action.
Key Social Media Facts 2025: Quick Reference
Essential Social Media Statistics:
- 5.31 billion global social media users (64% of population)
- 6.83 average platforms used per person monthly
- 2h 19m daily time spent on social media
- 38.3% use social media for work-related activities
- $247.3 billion projected social media ad spend
Top Platform Rankings by Users:
- Facebook: 3.07 billion monthly active users
- YouTube: 2.5 billion monthly active users
- Instagram: 2 billion monthly active users
- WhatsApp: 2 billion monthly active users
- TikTok: 1.5 billion monthly active users
Engagement Rate Leaders:
- TikTok: 4.07% average engagement
- Instagram: 0.60% average engagement
- Facebook: 0.15% average engagement
- Twitter/X: 0.05% average engagement
B2B Social Media Trends 2025:
- Social commerce to hit $1 trillion globally
- 93% of marketers using AI for content creation
- Gen Z + Millennials drive 62% of social commerce spend
- Short-form video dominates all platform algorithms
- Influencer marketing budgets exceed traditional social ads
FAQ: Social Media Facts for B2B {#faq}
What are the most important social media statistics for B2B companies in 2025?
The most critical social media facts for B2B companies include: 5.31 billion global users (64% of population), 38.3% using platforms for work-related activities, average engagement across 6.83 platforms monthly, and TikTok leading engagement at 4.07% compared to LinkedIn’s professional focus.
How many people use social media for business research in 2025?
Over 38% of social media users engage in work-related activities, with 82% using social platforms for product research. Gen Z prefers TikTok (55%) while Millennials favor Facebook (52%) for business research.
Which social media platform has the highest engagement rate in 2025?
TikTok leads with 4.07% average engagement rate, followed by Instagram (0.60%), Facebook (0.15%), and Twitter/X (0.05%). This makes TikTok 6x more engaging than Instagram for audience interaction.
How much do companies spend on social media marketing in 2025?
Social media ad spend is projected to reach $247.3 billion in 2025, with brands expected to spend more on influencer marketing than traditional social ads for the first time. This represents a 14.3% increase from 2024.
What percentage of B2B buyers use social media for purchasing decisions?
73% of people aged 18-34 have made purchases through social media, with Gen Z and Millennials accounting for 62% of global social commerce spend by 2025. This demographic represents current and future B2B decision-makers.
How much time do people spend on social media daily in 2025?
Users spend an average of 2 hours and 19 minutes daily on social media (14% of waking hours), engaging with an average of 6.83 different platforms monthly. YouTube sees almost twice the time investment of its nearest competitor.
What is social commerce and why does it matter for B2B?
Social commerce enables direct purchasing through social platforms, projected to hit $1 trillion in 2025 and $8 trillion by 2030. For B2B, it represents how buying behaviors are shifting, with 17% of online sales occurring through social networks.
How are AI tools changing social media marketing in 2025?
93% of practitioners believe AI reduces creative fatigue, with 69% seeing it as revolutionary technology. Brands need 48-72 posts weekly across platforms, making AI essential for content creation at scale while maintaining human strategy oversight.
Which generation drives the most social media engagement?
Gen Z dominates with 90% usage rates (ages 18-24), followed by Millennials at 88% (ages 25-34). By 2025, Millennials will account for 33% of social commerce spending, making them the largest spending demographic.
How important is video content for social media marketing?
Short-form video performs best across all platforms, with consumers preferring video content for brand discovery. TikTok’s 43.8% conversion rate and Instagram’s focus on Reels demonstrate video’s dominance in engagement and sales.
What are the best social media platforms for B2B marketing in 2025?
LinkedIn remains professional-focused, but Facebook (3B users), YouTube (2.5B users), and Instagram (2B users) offer broader reach. The key is platform diversification since users engage across 6.83 platforms monthly.
How fast is social media user growth in 2025?
Social media adds approximately 8.1 new users per second (256 million annually), with 5.2% growth rate. By 2028, over 6 billion people will use social media, representing massive market opportunity expansion.
