

By Vinay Koshy | Last Updated: July 2026
Vinay Koshy is the founder of Sproutworth and host of the Predictable B2B Success podcast, where he has interviewed 500+ B2B revenue leaders on content strategy and demand generation.
Quick Answer
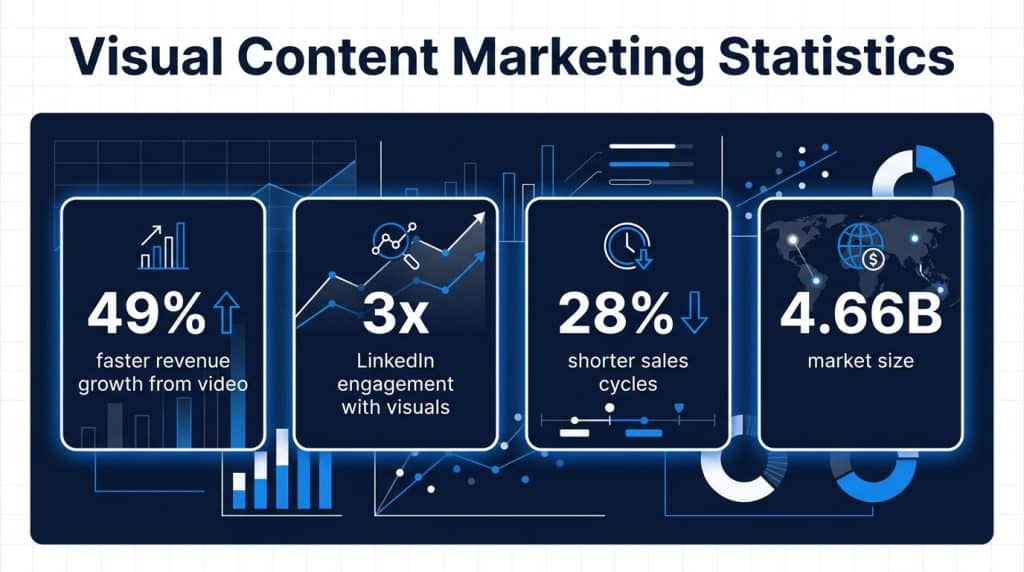
Visual content marketing statistics show that visual formats consistently outperform text across every B2B metric that matters. Companies using video grow revenue 49% faster than those that do not. Data-driven infographics earn 50% more backlinks than written content. LinkedIn posts with visuals generate 3x more engagement. The global visual content market reached $14.66 billion in 2026.
Why Visual Content Statistics Matter for B2B
Visual content marketing statistics consistently show one pattern: visual formats outperform text in engagement, retention, and revenue impact across every B2B buying stage. The global visual content market reached $14.66 billion in 2026 and is projected to rea