
By Vinay Koshy | Last Updated: July 2026
Vinay Koshy is the founder of Sproutworth and host of the Predictable B2B Success podcast, where he has interviewed 500+ B2B revenue leaders on content strategy and demand generation.
Quick Answer
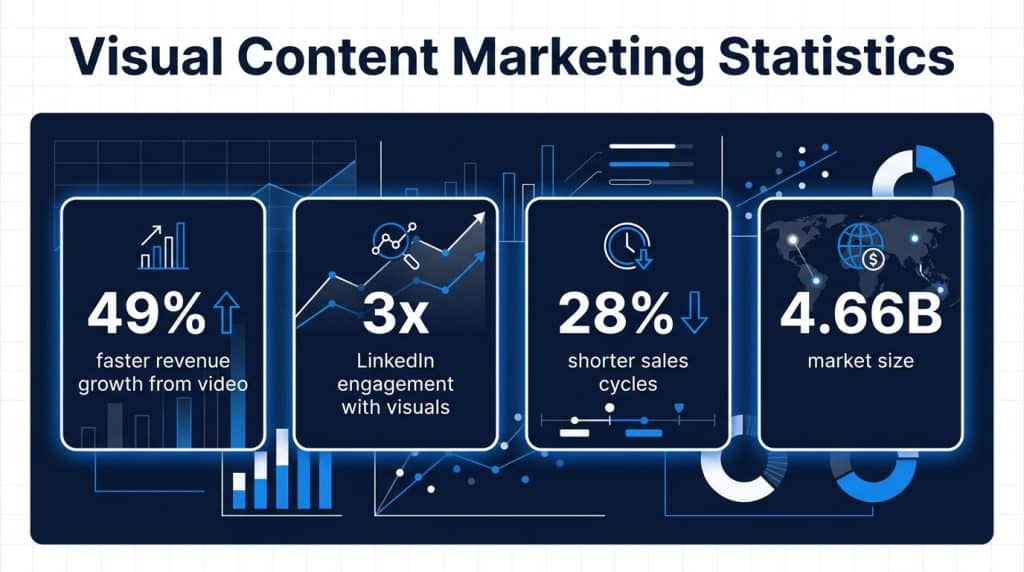
Visual content marketing statistics show that visual formats consistently outperform text across every B2B metric that matters. Companies using video grow revenue 49% faster than those that do not. Data-driven infographics earn 50% more backlinks than written content. LinkedIn posts with visuals generate 3x more engagement. The global visual content market reached $14.66 billion in 2026.
Why Visual Content Statistics Matter for B2B
Visual content marketing statistics consistently show one pattern: visual formats outperform text in engagement, retention, and revenue impact across every B2B buying stage. The global visual content market reached $14.66 billion in 2026 and is projected to reach $58.45 billion by 2035. For funded B2B tech companies, these numbers are operational benchmarks, not trends to monitor. This post organizes the most useful visual content data by business impact category, with strategic context for each.
Table of Contents
Key Stats at a Glance
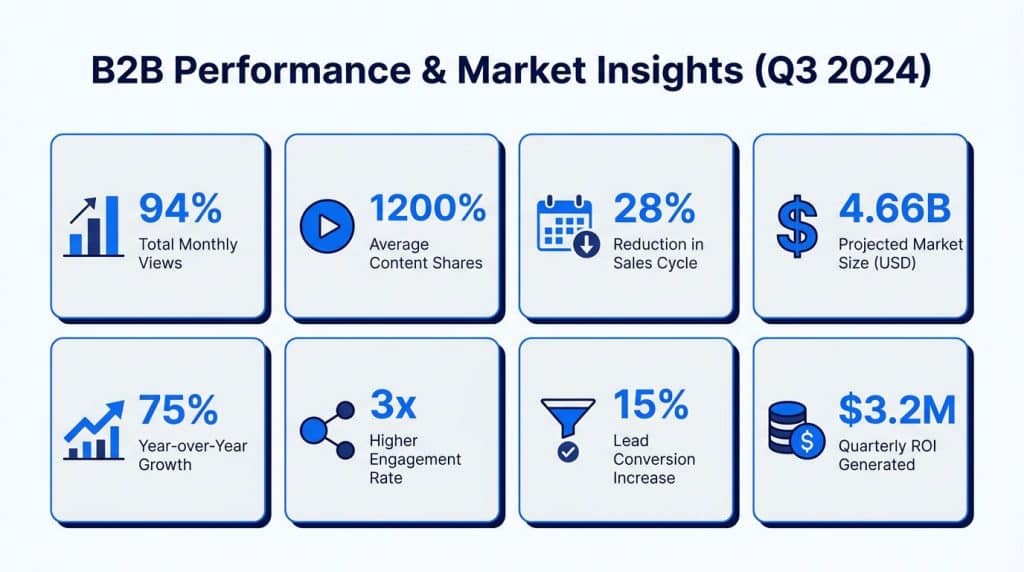
- 94% more views: articles with images vs. text-only (Outbrain, 2025)
- 1,200% more shares: social video vs. text and image posts combined (Brightcove)
- 28% shorter B2B sales cycles when video is used (Aberdeen Group, 2025)
- 49% of all ROI-driving content in 2026 is short-form video (HubSpot State of Marketing, 2026)
- 50% more backlinks: data-driven infographics vs. written content (Zebracat, 2025)
- $14.66 billion: global visual content market size in 2026 (Business Research Insights)
- 2.9x faster revenue growth for brands with strong visual identities (Gitnux, 2026)
- 61.5% of marketers now use AI to create visual content (Venngage, 2024)
- 80% of what people see is retained vs. 20% of what they read (Brain Rules)
- 3x higher ROI for visual campaigns vs. text-based equivalents (Gitnux, 2026)
What Is Visual Content Marketing?
Visual content marketing is the strategic use of images, videos, infographics, and data visualizations to educate and convert a target audience. The human brain processes visual information 60,000 times faster than text and retains 80% of what it sees versus 20% of what it reads, according to John Medina’s research in Brain Rules. For B2B tech companies, visual content marketing functions as a buyer-education system that compresses the research cycle and builds category authority before the first sales conversation.
Visual content is a pipeline mechanism, not a design investment. A well-designed infographic, a 60-second product explainer, or a data visualization shared internally by one enterprise buyer generates more pipeline than most whitepapers. The format change is the compounding lever.
The practical distinction matters for budget and headcount decisions. B2B tech companies at Series A and B typically allocate content budget to written formats: case studies, blog posts, and whitepapers, by default. The visual content marketing statistics below show that rebalancing toward visual formats at those same budget levels produces measurably better outcomes on the metrics that fund the next round.
Visual Content Format Performance for B2B
| Format | ROI Rating | Best Platform | Primary B2B Use | Avg. Production Cost |
|---|---|---|---|---|
| Short-form video (<60s) | Highest | LinkedIn, YouTube | Thought leadership, demos | $200-$800 per piece |
| Data-driven infographics | High | LinkedIn, blog posts | Link building, lead gen | $500-$2,000 per piece |
| Long-form video (>2 min) | High | YouTube | Case studies, walkthroughs | $1,000-$5,000 per piece |
| Images and charts in posts | Medium | Blog, email | Stat posts, explainers | $50-$300 per piece |
| Interactive content | Medium | Website | Calculators, assessments | $2,000-$10,000 per piece |
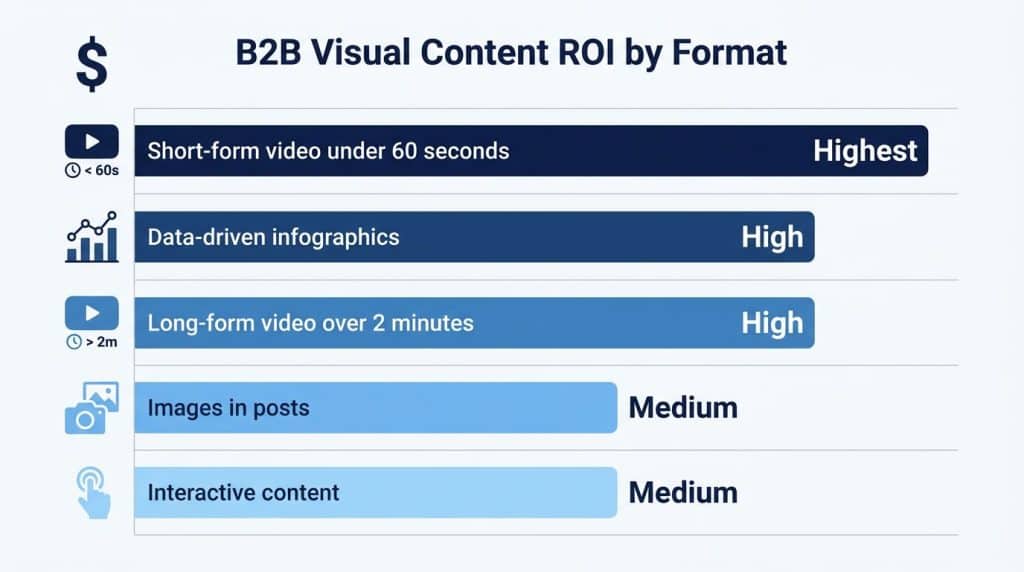
For seed-to-Series B companies with lean content teams, short-form video and data-driven infographics deliver the highest return per production hour. Start there before investing in interactive or long-form formats.
Visual Content Market Size Statistics
The global visual content market is one of the fastest-growing segments in B2B marketing.
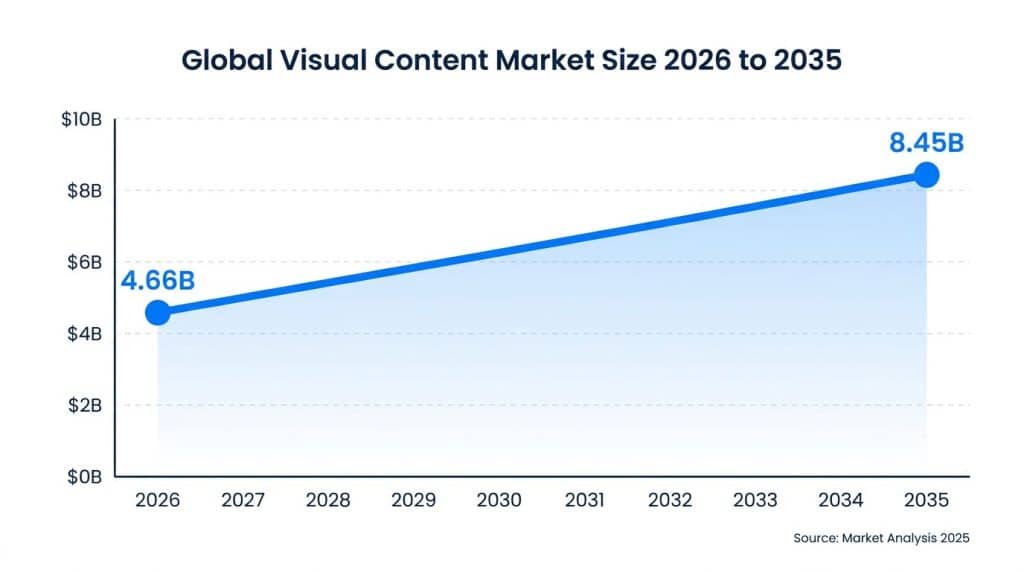
The market reached $14.66 billion in 2026 and is projected to reach $58.45 billion by 2035, representing a compound annual growth rate of 16.6% (Business Research Insights). That scale reflects a structural market shift: visual formats are now the primary medium for B2B information consumption, not a supplementary channel.
Overall, content marketing is projected to reach $107 billion in global revenue by 2026 (Statista). The visual content segment is growing faster than the broader category. For a funded B2B tech company deciding where to concentrate content investment, that trajectory matters. The companies building systematic visual content programs now are establishing authority that will compound over the next three to five years.
The adoption data confirms where the market is heading:
- 85% of marketers say visual content is a core part of their strategy in 2026 (Venngage)
- 95.2% of marketers say visual content is important to their marketing strategy (Venngage, 2024)
- 23.8% say their strategy is “nothing without visual content” (Venngage, 2024)
- 62% of all visual media used by enterprises for marketing is video (Wyzowl, 2026)
- Short-form video accounts for 49% of all ROI-driving content types in 2026 (HubSpot)
- 57% of B2B marketers used data visualizations as a content format in 2024-2025 (Content Marketing Institute)
The market size statistics tell you where investment is going. The performance statistics below tell you why.
Visual Content ROI: The Numbers B2B CFOs Need
Most visual content marketing statistics focus on engagement metrics: shares, views, likes. This section focuses on the business outcome data that CFOs and CROs use to evaluate content investment.
Revenue impact:
- Brands with strong visual identities grow revenue 2.9x faster than those without (Gitnux, 2026)
- Companies using video marketing grow revenue 49% faster year over year (Aberdeen Group)
- Visual campaigns yield 3x higher ROI than text-based equivalents (Gitnux, 2026)
- Visual content marketing generates 3x more leads than traditional outbound at one-third of the cost (Demand Metric)
Sales cycle impact:
- Video content use reduces B2B sales cycle length by 28% (Aberdeen Group, 2025)
- 84% of video marketers report direct lead generation impact from video content (Wyzowl, 2026)
- 66% more qualified leads are generated annually by companies using video marketing (Wyzowl, 2026)
- Video testimonials increase sales by 34% vs. text-only testimonials (Gitnux, 2026)
Pipeline impact:
- Infographic users report a 40% increase in leads generated (Gitnux, 2026)
- Visual landing pages convert 25% better than text-only landing pages (Gitnux, 2026)
- LinkedIn visual posts lead to 45% more inbound opportunities (Gitnux, 2026)
Calculating your visual content ROI:
For a Series B B2B tech company with a $3M ARR base and an average deal size of $40,000:
- If visual content reduces the sales cycle by 28%, and the average cycle is 90 days, that’s 25 fewer days per deal
- If the team closes 5 deals per month, recovering 25 days per deal = roughly 1 additional deal per quarter
- At $40,000 ACV: +$160,000 per year attributable to visual content’s sales cycle compression
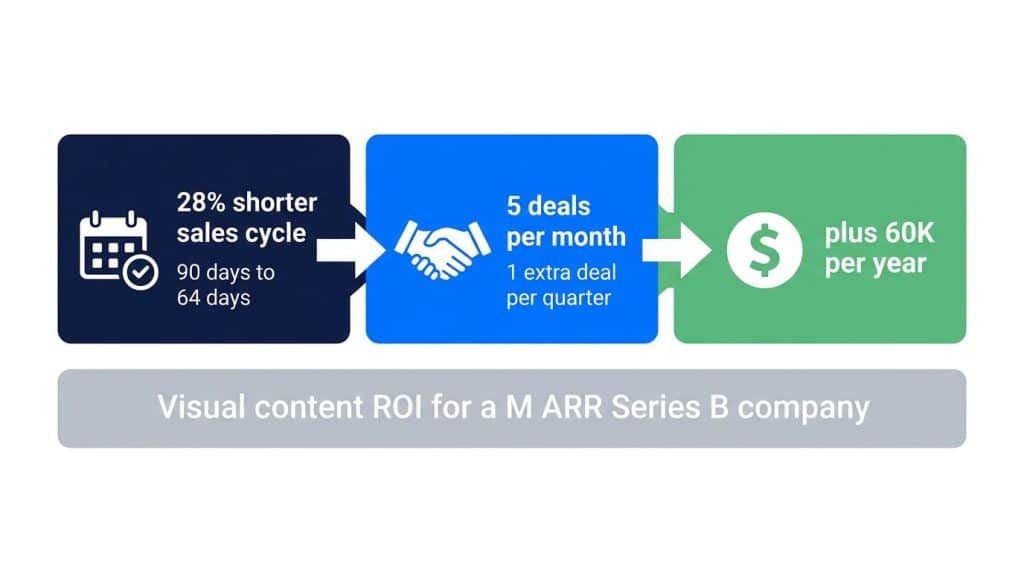
This is not a theoretical exercise. It is the direct revenue math that justifies visual content investment to a board.
How Does Visual Content Drive B2B Revenue?
Visual content marketing statistics show four direct revenue mechanisms for funded B2B companies: faster processing, longer retention, increased engagement, and compressed sales cycles.
Processing speed: The brain processes visual information 60,000 times faster than text (Brain Rules). Enterprise buyers spend an average of 8 seconds deciding whether to engage with content before moving on. In that window, a well-designed visual communicates what three paragraphs cannot. Attention compression is a specification for how B2B content must be built, not a constraint to work around.
Retention: People remember 80% of what they see versus 20% of what they read (Brain Rules). Adding a relevant image to text increases content retention from 10% to 65% after three days (HubSpot). For a B2B tech company building category authority with enterprise buyers over a 9 to 18 month sales cycle, a 6.5x improvement in content retention is a direct competitive advantage.
Engagement multiplier: Visual content is 40x more likely to get shared on social platforms than text alone (HubSpot). Articles with images receive 94% more views than text-only articles (Outbrain, 2025). Emails with visual elements have 300% higher click-through rates than text-only emails (Gitnux, 2026).
Recall and brand authority: Custom visuals increase brand recall by 89% (Gitnux, 2026). High-contrast visuals improve readability and effectiveness by 47% (Gitnux, 2026). Data stories told visually retain 65% more information after three days (Gitnux, 2026).
After 500+ interviews with B2B revenue leaders on the Predictable B2B Success podcast, one pattern holds consistently: companies that build systematic visual content programs at Series A close larger deals faster at Series B. The compounding effect starts earlier than most founders expect.
Video Marketing Statistics for B2B
Video has become the dominant format in B2B content marketing. For the first time in Content Marketing Institute’s survey history, video overtook case studies as the most effective B2B content type in 2025. Understanding the specific numbers behind that shift clarifies where to allocate production budget.
Video adoption and effectiveness:
- 76% of B2B marketers used video in the past 12 months (CMI, 2025)
- 93% of marketers say video is an important part of their strategy (HubSpot, 2026)
- 82% of marketers say video provides positive ROI (Wyzowl, 2026)
- 58% of B2B marketers now rate video as their most effective content type (CMI, 2025)
- 72% of internet users prefer video over text for learning about products (Gitnux, 2026)

Format performance:
- Short-form video (<60 seconds): top ROI format in 2026 (HubSpot State of Marketing)
- Long-form video: 29% ROI rating among marketers (HubSpot, 2026)
- Live-streaming: 25% ROI rating among marketers (HubSpot, 2026)
- Explainer videos achieve 80% watch-through rates on average (Gitnux, 2026)
- Short-form videos under 90 seconds retain 50% more viewers than longer formats (Gitnux, 2026)
Investment trends:
- 69% of B2B marketers plan to increase video investment in 2026 (WebFX)
- Video content generates 88% of B2B marketers’ LinkedIn strategies (Gitnux, 2026)
- Product demo videos convert 20% higher than image-only product pages (Gitnux, 2026)
For B2B tech companies with lean teams, one 60-second explainer with a clear ICP angle published weekly on LinkedIn outperforms a quarterly long-form production. Both in reach and in pipeline attribution.
The investment timing argument: Funding video at the seed stage costs less and creates more competitive differentiation than funding it when every Series B company in your category is already doing it. The compounding benefit of a systematic video program starts 18 months before most founders think to start.
Infographic and Data Visualization Statistics
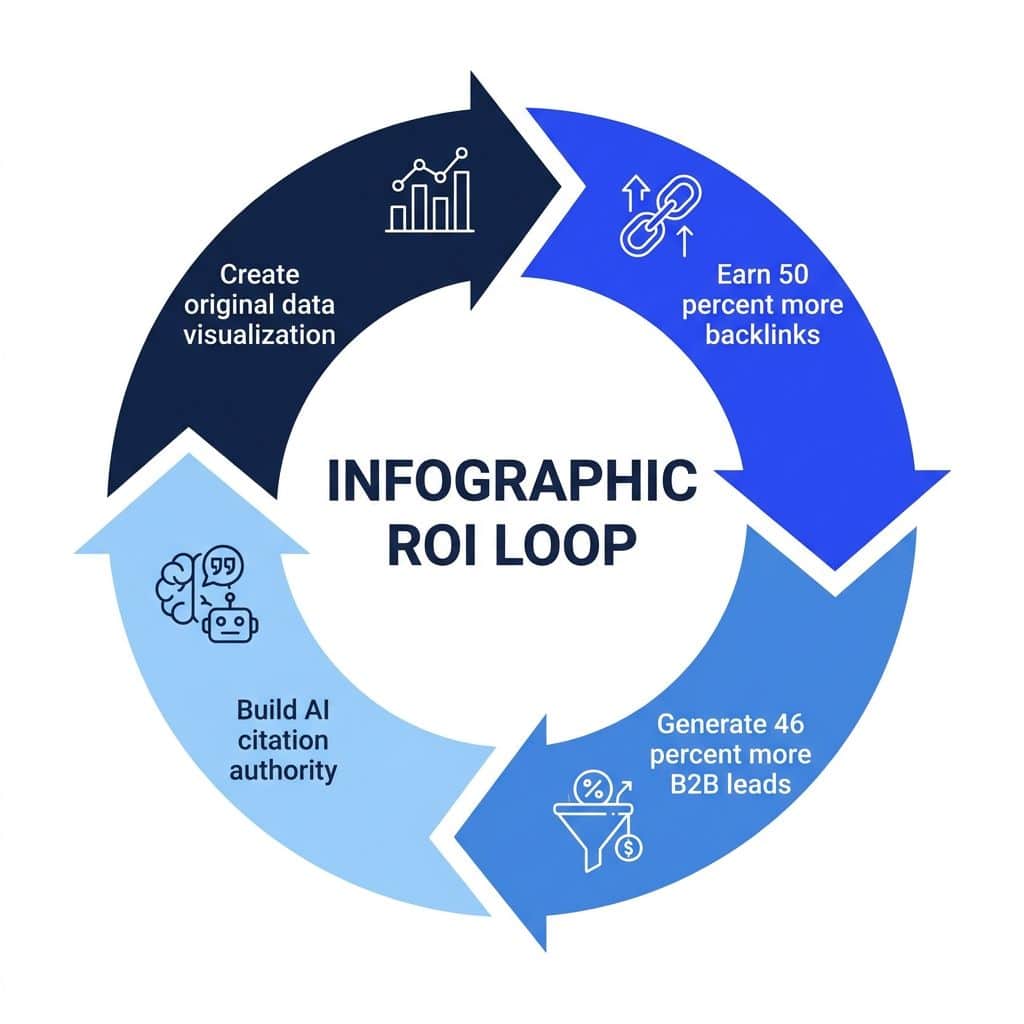
Infographics deliver two outcomes that no other visual content format matches at the same production cost: earned media and inbound backlinks.
Link building impact:
- Data-driven infographics attract 50% more inbound backlinks than written content (Zebracat, 2025)
- Companies using infographics see 30% higher web traffic than those that don’t (Gitnux, 2026)
- Infographics are 3x more likely to be liked and shared on social media than other content types (Gitnux, 2026)
Lead generation:
- 46% of B2B marketers say infographics produce the best lead-generation content (Marketing LTB, 2025)
- 57% of B2B marketers used data visualizations as a content format in 2024-2025 (CMI, 2025)
- 55% of B2B marketing campaigns incorporated infographics by 2025, up from 40% in 2018 (Zebracat, 2025)
Retention and comprehension:
- Animated infographics retain 65% more information than static ones (Gitnux, 2026)
- Data visualizations in reports increase shareability by 40% (Gitnux, 2026)
- Interactive infographics generate 35% more time spent on page vs. static versions (Gitnux, 2026)
The 46% lead-generation finding is widely misread. Most B2B tech companies treat infographics as awareness content. The data says they perform as lead-generation content. The mechanism is internal shareability: an infographic that one procurement decision-maker shares with three colleagues generates more pipeline than a whitepaper sitting behind a form.
A Series A cleantech company I work with published a single proprietary data visualization and earned links from three tier-1 industry publications within six weeks. That is the digital PR flywheel operating at its most efficient. Proprietary data, clearly visualized with a specific B2B CEO angle, performs at a level that generic stat compilations never reach.
Social Media Visual Content Statistics by Platform
Visual content on social platforms delivers measurably different engagement than text-only posts. The B2B implications vary by platform, so the statistics below are broken out by channel.
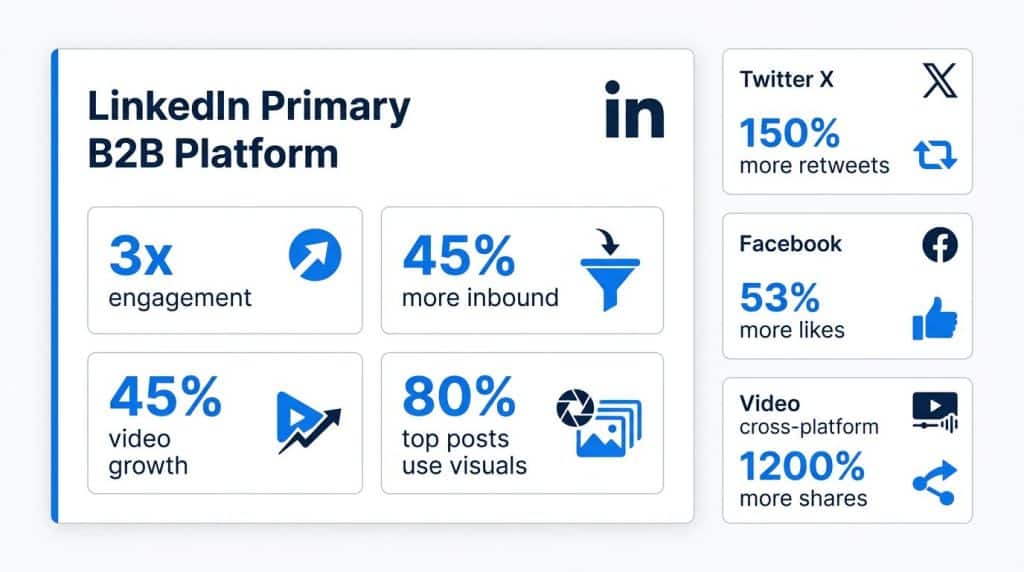
LinkedIn (Primary B2B platform):
- LinkedIn posts with visuals generate 3x more engagement than text-only posts (Sprout Social, 2025)
- LinkedIn video views grew 45% year-over-year (Gitnux, 2026)
- LinkedIn visual posts lead to 45% more inbound opportunities (Gitnux, 2026)
- 80% of top-performing LinkedIn posts include visuals (Gitnux, 2026)
- LinkedIn Carousel visuals are used in 40% of B2B campaigns (Gitnux, 2026)
- Carousel posts on LinkedIn see 2x higher engagement than single images (Gitnux, 2026)
Cross-platform engagement data:
- Social video generates 1,200% more shares than text and image posts combined (Brightcove)
- Articles with images receive 94% more views than text-only articles (Outbrain, 2025)
- Tweets with images get 150% more retweets than text-only tweets
- Facebook posts with visuals get 53% more likes than non-visual posts (Gitnux, 2026)
- Posts with human faces in images get 38% more likes on Facebook (Gitnux, 2026)
For B2B tech companies, LinkedIn is where these numbers convert to pipeline. The 3x engagement multiplier on LinkedIn is not a vanity metric. It drives profile visits, connection requests, and inbound inquiries from exactly the buyer profile that funded B2B companies target. A LinkedIn post reaching 10,000 impressions with strong visual content generates a different downstream pipeline than a text post at the same impression count.
The practical implication is that you do not need to be present on every platform. Build a systematic visual content cadence on LinkedIn, distribute longer formats to YouTube for SEO compounding, and let your own blog capture organic search. Everything else is optional at the Series A and B stage.
AI and Visual Content Statistics
AI has materially changed the economics of visual content production for B2B tech companies.
Current AI adoption in visual content:
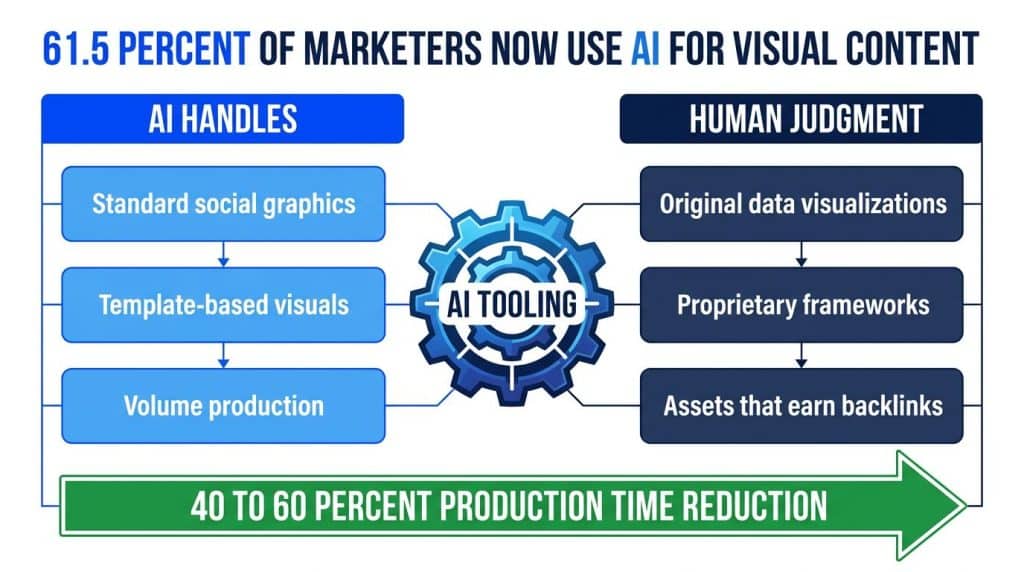
- 61.5% of marketers now use AI to create visual content (Venngage, 2024)
- 37.5% of marketers use AI to generate images (Venngage, 2024)
- 51.5% use AI for social media graphics (Venngage, 2024)
- AI-powered visual content tools have reduced production time by an estimated 40-60% for standard social graphics (Venngage State of Visual Content, 2024)
What AI changes for lean teams:
The production cost and time barriers that previously made systematic visual content inaccessible to lean teams have been substantially reduced. A B2B tech company with one content marketer can now maintain a visual content cadence that previously required a team of three.
What AI does not change:
AI tools have lowered the production floor. The quality ceiling has not moved. The volume of AI-generated visual content across LinkedIn, blogs, and industry media is increasing rapidly. Generic AI-produced visuals now blend into background noise. Original data visualizations, proprietary frameworks rendered as graphics, and brand-consistent custom imagery still differentiate. The strategy is to use AI for volume and human judgment for the assets that earn attention and backlinks.
The AI citation angle: Visual content now directly affects whether your content is cited by AI answer engines like Perplexity, ChatGPT, and Google’s AI Overviews. Pages with structured visual content (clear images with descriptive alt text, original data visualizations, and embedded infographics) are more likely to be surfaced in AI-generated responses. This is a compounding benefit that most competitors are not yet optimizing for. See our full guide to Generative Engine Optimization for the technical steps.
What B2B Tech CEOs Should Do With This Data
The visual content marketing statistics in this post point to one operational conclusion: visual content is a system decision, not a campaign decision.
Companies that treat visual content as a project (“let’s do an infographic this quarter”) produce inconsistently and fail to build the compounding authority that drives inbound. Companies that treat it as a system, with consistent formats, a regular production cadence, and clear ICP alignment, are the ones that appear in enterprise shortlists and AI-generated answers simultaneously.
Three actions with the highest ROI per hour for funded B2B tech companies:
1. Build a short-form video cadence first. 60 seconds, one insight, one ICP pain point, published weekly on LinkedIn. The production bar is lower than most founders assume, and the ROI data supports it as the first investment. 93% of marketers say video is important to their strategy. The competitive disadvantage of not starting compounds each quarter you delay.
2. Commission one proprietary data visualization per quarter. Not a stat compilation. Original research from your customer base, your platform data, or your proprietary methodology. Visualized clearly. Pitched to industry publications. This infographic format earns backlinks and AI citations, and it is the format none of your competitors can replicate.
3. Reformat your best-performing written content as visual content. Your highest-traffic blog post, your most-shared whitepaper, your strongest case study. Each has a visual version waiting to be produced. The 94% increase in views (Outbrain) applies to that existing content.
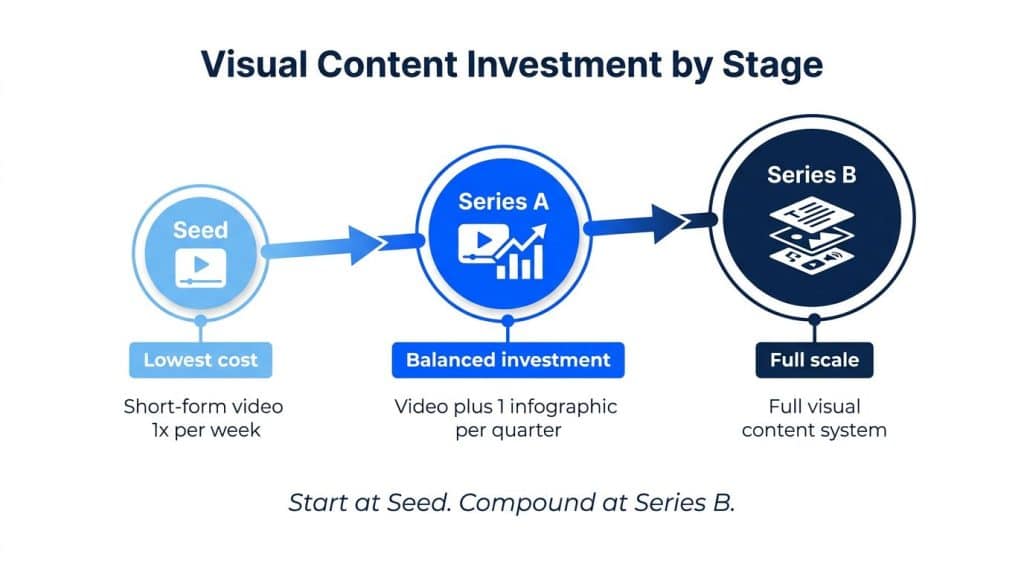
Stage-specific guidance:
| Stage | Priority visual format | Why |
|---|---|---|
| Seed | Short-form video (1x/week) | Lowest production cost, fastest ICP feedback loop |
| Series A | Short-form video + 1 infographic/quarter | Add link building and lead gen layer |
| Series B | Full visual content system: video, infographics, interactive | Scale what works; add brand authority signals |
At Sproutworth, we help B2B tech companies at Series A and Series B build the content systems that drive these outcomes. The visual content marketing statistics in this guide are the same benchmarks we use to diagnose content programs and rebuild them around formats that actually produce pipeline. See our B2B content strategy guides for the specific frameworks behind each format.
Frequently Asked Questions
What are the most important visual content marketing statistics for B2B companies?
The most operationally useful visual content marketing statistics for B2B companies are: video content reduces sales cycle length by 28% (Aberdeen Group, 2025), data-driven infographics generate 50% more backlinks than written content (Zebracat, 2025), LinkedIn posts with visuals receive 3x more engagement than text-only posts (Sprout Social, 2025), and brands with strong visual identities grow revenue 2.9x faster than those without (Gitnux, 2026). These four statistics connect visual content directly to pipeline and revenue outcomes, not just engagement.
How much budget should B2B companies allocate to visual content?
The data supports allocating 30 to 50 percent of content production budget to visual formats for funded B2B tech companies. HubSpot’s 2026 data show that short-form video delivers the highest ROI of any content format. CMI’s 2025 B2B report shows 69% of marketers plan to increase video investment. For a Series A company spending $10,000/month on content, that means $3,000-$5,000 directed at visual formats: primarily short-form video and quarterly infographics. The specific allocation depends on the sales cycle length, the content team size, and the primary distribution channels.
Which visual content type generates the most B2B leads?
46% of B2B marketers say data-driven infographics produce the best lead-generation content (Marketing LTB, 2025). Short-form video under 60 seconds delivers the highest overall ROI in 2026 (HubSpot). The best format depends on channel: infographics perform best on LinkedIn and in blog content for backlink-driven lead gen, short-form video performs best on LinkedIn and YouTube, and interactive tools perform best on landing pages. Most B2B companies underweight infographics as a lead-gen format. The data says they should not.
How does visual content affect SEO and organic search performance?
Visual content improves SEO through four direct mechanisms. Pages with images receive 94% more views than text-only pages (Outbrain). Data-driven infographics attract 50% more inbound backlinks than written content (Zebracat, 2025). Image optimization can increase organic visibility by up to 63%. Visual content also increases average time on page, which is a positive Google ranking signal. For B2B tech companies, the highest-ROI SEO move is adding original visual content to existing high-performing posts. The data (94% more views) applies to content that already ranks.
What visual content statistics matter most for enterprise B2B sales?
For enterprise B2B with long sales cycles, the retention and compression data matter most. People retain 80% of what they see versus 20% of what they read (Brain Rules). Adding images to text increases retention from 10% to 65% after three days (HubSpot). Video content reduces B2B sales cycle length by 28% (Aberdeen Group, 2025). For companies with 6-18 month enterprise sales cycles, visual content that improves buyer memory and compresses decision timelines is a direct revenue lever, not a marketing expense.
How is AI changing visual content marketing for B2B companies?
AI has reduced visual content production time by 40-60% for most B2B teams (Venngage, 2024). 61.5% of marketers already use AI to create visual content. A one-person content operation can now maintain the visual cadence that previously required three people. The strategic risk is that generic AI-generated visuals are now ubiquitous and no longer differentiate. The winning approach is using AI for volume production of standard social graphics while directing human effort toward original data visualizations and proprietary frameworks that earn backlinks and AI citations.
Related Resources
- B2B Content Marketing Strategy Guide for CEOs
- Generative Engine Optimization: How to Appear in AI-Generated Answers
- AEO vs SEO: What B2B Companies Need to Know in 2026
- Thought Leadership Ghostwriting: The System Behind Authority Content
- The Predictable B2B Success Podcast

3 thoughts on “Visual Content Marketing Statistics: Data for B2B CEOs”
Comments are closed.