Most B2B customer journey maps are expensive wall art. After 500+ conversations with funded B2B tech founders on the Predictable B2B Success podcast, one pattern is consistent. The companies spending the most on journey mapping are often the ones getting the least from it.
This guide covers what actually works, at every revenue stage from $0 to $200M ARR.
Updated April 2026 to include revenue-bracket touchpoint framework ($0 to $200M ARR) and 2026 B2B buyer data.

What Is a Customer Journey Map (and Why Most B2B Versions Fail)?
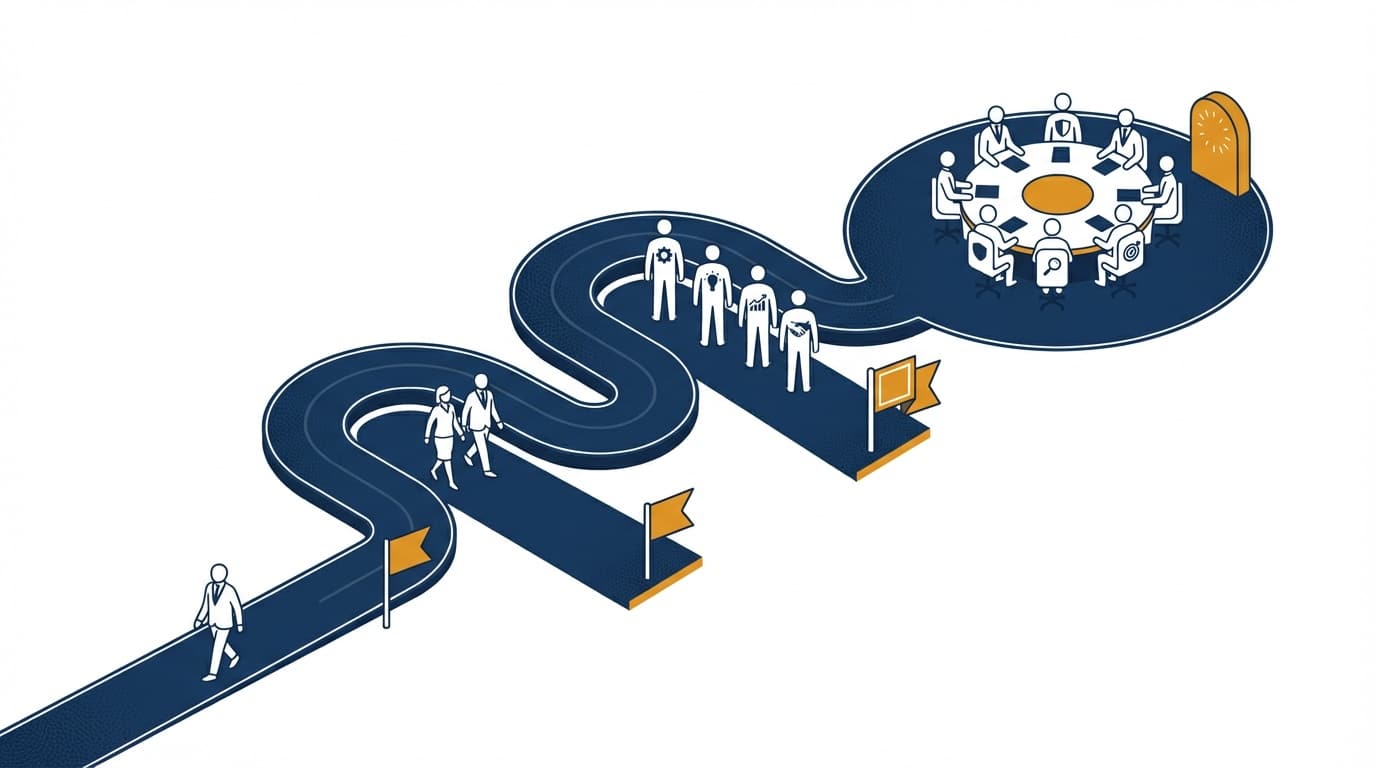
A customer journey map is a visual document that traces every touchpoint a buyer has with your company, from first awareness through post-sale advocacy. In B2B, this is rarely a simple path. A typical Series B SaaS deal involves 6 to 10 stakeholders, a sales cycle measured in months, and touchpoints spread across channels you do not fully control.
The difference between a map that drives revenue and one that gathers dust is one word: specificity. Generic maps describe what should happen. Revenue-driving maps document what actually happens, at your current revenue bracket, for your actual buyers.
KEY STAT: 89% of companies now compete solely on customer experience, but 73% of B2B tech companies build journey maps that generate zero ROI. The gap is not effort, it is specificity.
The $2 Million Journey Map That Generated Zero ROI
Last month, I spoke with a Series B SaaS CEO who had just discovered that his company had spent $2.1 million on customer journey mapping over the past 18 months.
The result? A gorgeous 47-slide presentation gathering digital dust.
Zero improvement in conversion rates. No reduction in churn. Not a single actionable insight that moved the revenue needle.
This isn’t uncommon. Companies like a large telecom provider have spent upwards of $2 million on journey mapping without seeing a return on investment, nor have they seen any improvement in customer satisfaction scores or an impact on the Net Promoter Score (NPS).
89% of companies now compete solely on customer experience (CX), and businesses boasting strong customer journey mapping (CJM) see a 54% higher ROI, but most B2B tech companies are building maps that actively hurt their growth.
KEY STAT: 89% of companies now compete solely on customer experience, but 73% of B2B tech companies build journey maps that generate zero ROI.
They’re creating beautiful fiction instead of revenue-driving strategy.
Why Most Customer Journey Maps Fail Spectacularly
The Assumption Trap
The biggest mistake marketers make here is that they create customer personas through internal exercises without ever conducting real customer research, talking to actual people, or collecting genuine data, which results in the creation of non-realistic customer personas.
I’ve seen engineering teams build detailed personas for “Decision-Maker David” based entirely on what they think their customers want. Meanwhile, their actual buyers are 29-year-old product managers who research on TikTok and make purchase decisions via Slack polls.
The disconnect is staggering. This is precisely why developing cohesive branding elements requires thorough audience research, rather than relying on internal assumptions.
“I have seen Series A founders spend six months building a journey map that describes their ideal customer, then spend the next six months wondering why none of their actual customers match it. Journey maps built from assumptions are marketing fiction.”, Vinay Koshy, Sproutworth
The Static Document Disease
Customer journeys are fluid; they shift with changes in technology and consumer expectations. Unfortunately, many journey maps are treated as static documents, unable to adapt to new realities.
Your customers changed their behavior 847 times since your last journey map update. Millennials and Gen Z make up roughly two-thirds of B2B buyers – prefer to learn from your website, not your people, yet most journey maps still assume lengthy sales calls drive decisions.
This shift toward data-driven culture means your journey maps need to evolve as quickly as your customer behavior data.
The Company-Centric Curse
The deadliest mistake? Building maps from your perspective, rather than your customer’s.
When you map the journey from the company’s perspective you fail to acknowledge the needs and desires of your customers. Without recognizing your customers’ needs and desires, you cannot improve your service experience for the customers.
I’ve watched teams spend months mapping their internal handoff processes, while completely missing the fact that customers abandon their funnel because of a confusing pricing page. This is why implementing effective conversion rate optimization requires understanding your customer’s perspective, not your internal processes.
What Does the Data Say About B2B Customer Journey Mapping in 2026?
Gartner found that 82% of organizations have created customer journey maps, but only 47% use them effectively. The map is not the problem. What happens after the map is built is the problem.
Here’s what’s actually happening in B2B tech buying behavior:
BUYER BEHAVIOR: 67% of B2B buyers complete their journey digitally, yet most journey maps still assume sales-driven processes.
Digital Dominance: Buyers now complete 67% of their journey digitally. Your expensive field sales team touches customers for maybe 5-6% of their decision process.
Micro-Moment Explosion: Google research identifies that the average customer journey now includes 20-500 touchpoints, depending on the complexity of the purchase. Most journey maps capture about 12.
Multi-Channel Reality: 67% of customers now use multiple channels to complete a single transaction, according to Harvard Business Review research. However, teams still create linear journey maps that assume customers follow a neat, sequential path.
This complexity is why building an effective omnichannel customer experience has become critical for B2B tech companies.
92% of B2B buyers already have at least one vendor in mind before they start evaluating options, according to Forrester’s Buyers Journey Survey. The journey map that matters most is the one shaping awareness, not the one managing the late-stage sales cycle.
On touchpoint volume: B2B customer journey touchpoints range from 15 to 266 per deal, depending on deal size and methodology, according to 2026 data aggregated by Prospeo. A sub-$50K annual deal averages 30 to 50 touchpoints. An enterprise deal above $500K regularly involves more than 100 tracked interactions across a buying committee that was never fully mapped.
The Revenue Impact of Getting It Right
When done correctly, customer journey mapping delivers measurable results:
REVENUE IMPACT: Companies with effective customer journey mapping see 54% higher ROI and up to 40% increases in conversion rates.
- Companies that invest in customer journey mapping can see up to a 20% increase in customer satisfaction, a 15% boost in customer retention, and up to a 25% increase in revenue by addressing drop-off points and improving customer engagement
- Effective customer journey mapping led to a remarkable boost in conversion rates. With effective customer journey mapping, businesses have unlocked impressive change – seeing conversion rocket by as much as 40%
But here’s the catch: these results only come from maps built on real customer data, not internal assumptions. This is precisely why effective lead nurturing tactics require understanding your actual customer journey, not your assumed one.
💡 CEO Takeaway: What This Means for Your Pipeline
- The touchpoints that matter at $2M ARR are not the same touchpoints that matter at $20M ARR. Build your journey map for the revenue bracket you are in, not the one you aspire to.
- A journey map is worthless without a named owner at each stage. Assign accountability before you document anything else.
- The biggest ROI from journey mapping comes from fixing the handoff between stages, not from redesigning any single stage in isolation.
- Companies with sales and marketing aligned on a single journey map see 36% higher net revenue retention and 208% higher revenue growth than those operating from separate assumptions.
Customer Journey Touchpoints by Revenue Bracket: $0–1M to $200M ARR
Most journey mapping frameworks treat all B2B companies the same. They do not account for the fact that a $500K ARR startup and a $100M ARR company are operating completely different buying motions, with different decision-maker counts, different sales cycles, and different post-sale pressures. The touchpoints that matter at each stage are not the same.
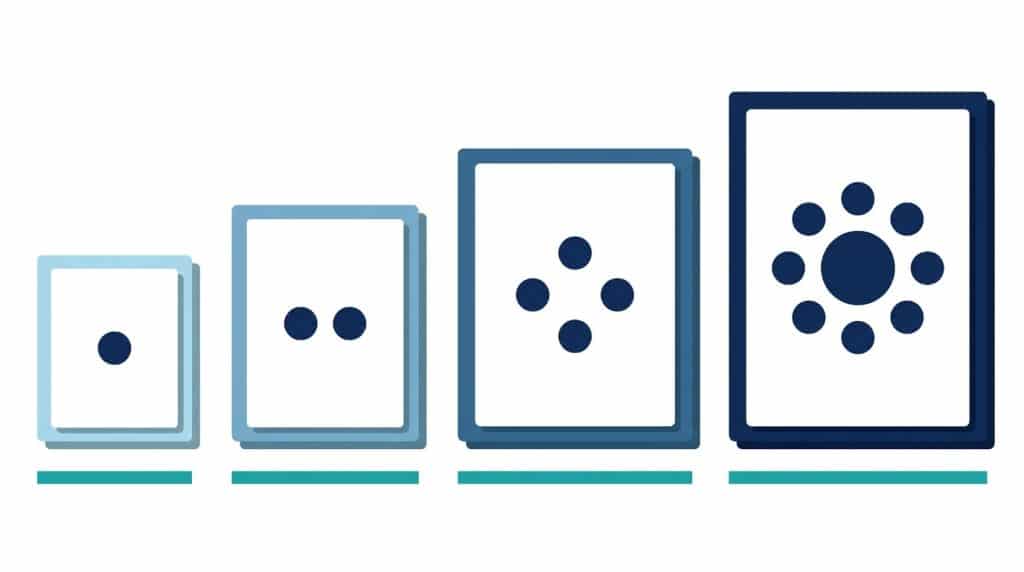
CITABLE STAT: B2B buying journeys involve 6–10 stakeholders on average, but at the $0–1M ARR stage, 63% of purchase decisions are made by a single founder or solo decision-maker. The touchpoint map changes completely as headcount and revenue scale.
Here is how critical touchpoints shift across four revenue brackets, drawn from 500+ founder interviews and direct work with B2B tech companies from seed to Series C.
“The biggest journey mapping mistake at every revenue bracket is applying the previous bracket’s touchpoint model to the next stage. What closes deals at $2M ARR actively loses deals at $20M ARR.”
$0–1M ARR: The Founder-Led Journey
At this stage, the journey map is simple because the buying committee is almost never a committee. One person finds you, evaluates you, and decides. Your job is to make that person’s path from problem-aware to purchase as frictionless as possible.
| Stage | Key Touchpoints | What Actually Moves the Decision |
|---|---|---|
| Awareness | LinkedIn post, Google search, podcast mention, peer referral | Peer referral carries 70% of the weight. The founder is more likely to buy from someone a trusted contact mentioned than from organic content. |
| Evaluation | Website homepage, one or two blog posts, 30-min discovery call | The homepage and one conversation. If those do not build immediate trust, no nurture sequence will save the deal. |
| Purchase | Proposal, single email thread, short contract | Speed and simplicity. The founder does not want a multi-stage sales process. Proposal to close in under a week is the standard. |
| Post-sale | Onboarding call, Slack or email check-in, first deliverable | First deliverable quality sets the tone for the entire relationship. There is no CS team at this stage, the relationship is the retention engine. |
Journey mapping priority at $0–1M: Reduce friction from first contact to first conversation. The awareness and evaluation stages collapse into a single day for many buyers at this size. Your mapping effort should focus on the handoff from discovery call to proposal, that is where most sub-$1M deals stall.
$1M–$10M ARR: The Sales-Assisted Journey
The journey gets more complex here. A second stakeholder often enters, usually a VP of Marketing or CRO, and the evaluation stage extends. Content starts to pull actual weight because the founder can no longer be in every conversation.
| Stage | Key Touchpoints | What Actually Moves the Decision |
|---|---|---|
| Awareness | LinkedIn content, podcast interviews, SEO-ranked blog posts, G2/Clutch profile | Organic content becomes a real channel at this stage. A Series A founder researching content agencies will Google the problem before asking peers. SEO presence matters. |
| Evaluation | Multiple blog posts, case study, sales call with two stakeholders, proposal with ROI model | The case study. At this stage, the buyer wants proof that someone like them got results. A generic capabilities deck does not close deals; a specific before/after case study does. |
| Purchase | Legal review, contract negotiation, two to three rounds of stakeholder sign-off | Internal champion doing the selling for you. If your evaluation materials are not built to be shared internally, you lose at this stage even when the champion is convinced. |
| Post-sale | Structured onboarding, monthly reporting, 90-day review, renewal conversation | The 90-day review is the make-or-break moment. If you cannot show early momentum by then, churn risk spikes. |
Journey mapping priority at $1M–$10M: Build the evaluation stage materials your internal champion can use to sell you upstream. A one-page ROI summary, a relevant case study, and a clear comparison of your approach versus the status quo are what move multi-stakeholder deals at this revenue bracket.
$10M–$50M ARR: The Committee Journey
The economic buyer and the champion are now different people. A Series B company will have a CRO or VP Marketing leading the evaluation while the CEO signs off on the budget. The journey map must account for both paths running in parallel.
| Stage | Key Touchpoints | What Actually Moves the Decision |
|---|---|---|
| Awareness | Analyst mentions, LinkedIn thought leadership, conference presence, SEO for category-level queries | Reference calls. A formal reference from a peer company at a similar revenue stage outweighs any marketing material. Proactively build and maintain a reference network. |
| Evaluation | Detailed RFP or structured assessment, references from similar-sized companies, multi-call evaluation process | The expansion conversation. At this revenue bracket, the real LTV comes from account expansion, upsells, additional services, referrals. Post-sale journey mapping is as important as pre-sale mapping. |
| Purchase | Legal and finance review, security assessment, board-level approval in some cases | Risk reduction. The champion needs to be able to defend the decision internally. Everything in your sales process should be built to make the champion look smart, not just to close the deal. |
| Post-sale | The expansion conversation. At this revenue bracket, the real LTV comes from account expansion, upsells, additional services, and referrals. Post-sale journey mapping is as important as pre-sale mapping. | Dedicated account manager, QBRs, executive sponsor meetings, and expansion conversation at 6 months |
Journey mapping priority at $10M–$50M: Map the two parallel journeys, the champion’s and the economic buyer’s, and ensure your content and sales materials speak to both. The champion needs tactical proof; the economic buyer needs strategic confidence. These are different materials.
$50M–$200M ARR: The Enterprise Journey
At this scale, the buying committee has expanded to 8–12 people across procurement, legal, finance, IT security, and the business unit. The journey is long (6–18 months for significant contracts), non-linear, and heavily influenced by external validators.
| Stage | Key Touchpoints | What Actually Moves the Decision |
|---|---|---|
| Awareness | Analyst reports (Gartner, Forrester), industry conference presence, executive peer networks, AI-generated answers | Third-party validation. At this revenue bracket, self-promotion is discounted. Appearing in analyst reports, being cited by AI search engines, and having executive-level peer visibility drives initial consideration. |
| Evaluation | Formal RFP, pilot or proof of concept, multi-department stakeholder sessions, security review, legal due diligence | The POC (proof of concept). An enterprise buyer needs to see your solution working in their environment before committing. The evaluation journey is itself a product experience. |
| Purchase | Relationship depth at the executive level. The deals that close are those in which the seller has built genuine relationships with two or more C-suite stakeholders, not just the evaluation team. | The annual business review (ABR). At this scale, the ABR is not a retention tool; it is the expansion trigger. Companies that run rigorous ABRs showing documented ROI expand accounts at 2–3x the rate of those that do not. |
| Post-sale | Implementation team, executive sponsor program, annual business reviews, multi-year expansion roadmap | The annual business review (ABR). At this scale, the ABR is not a retention tool, it is the expansion trigger. Companies that run rigorous ABRs showing documented ROI expand accounts at 2–3x the rate of those that do not. |
Journey mapping priority at $50M–$200M: Invest in third-party credibility infrastructure, analyst relationships, AI citation optimization, and executive peer networks. These are the touchpoints that enterprise buyers trust at this bracket, and they operate outside your direct control. The companies that invest early in being cited and referenced consistently win more RFPs.
KEY INSIGHT: The single biggest journey mapping mistake at every revenue bracket is applying the previous bracket’s touchpoint model to the next stage. What closes deals at $2M ARR (a great discovery call and a strong proposal) actively loses deals at $20M ARR, where the champion cannot close the deal alone and needs committee-ready materials you have not built.
My Framework for Revenue-Driving Journey Maps
After working with funded B2B tech founders across seed to Series C, I have found a consistent set of principles that separate revenue-driving journey maps from expensive wall art. Here is what actually works:
1. Start With Real Customer Conversations (Not Personas)
Skip the internal persona workshop. Go talk to 15 customers who have made a purchase in the last 90 days.
Ask specifically:
- “Walk me through the exact steps you took before contacting us.”
- “What almost stopped you from moving forward?”
- “Where did you go to verify our claims?”
I’ve discovered that B2B buyers often make initial decisions based on a single piece of content, then spend weeks looking for reasons NOT to buy. Most journey maps miss this entirely. This is why asking better questions during customer research is crucial for creating an accurate journey map.
2. Map Emotional States, Not Just Touchpoints
Every action your customers take is motivated by emotion. And your customers’ emotions will change depending on where they are in their journey.
The moment a prospect realizes your solution might solve their problem? Pure excitement.
The moment they see your enterprise pricing? Terror.
The moment they can’t find a simple implementation timeline? Frustration that leads to churn.
Map these emotional transitions. They’re where revenue is won or lost. Understanding these emotional touchpoints is essential for creating a compelling storytelling content strategy that resonates at each stage.
3. Focus on Micro-Moments That Drive Decisions
Traditional journey maps focus on major stages: Awareness, Consideration, Decision.
Revenue-driving maps identify micro-moments:
- The 8-second window when prospects decide if your homepage is worth reading
- The exact moment in a demo when prospects mentally say “yes” or “no.”
- The specific objection that kills 67% of deals in your pipeline
These micro-moments in the customer experience design often determine whether buyers progress through your conversion path optimization or abandon the journey entirely. Understanding customer touchpoint analysis at this granular level separates successful B2B customer lifecycle management from generic buyer journey stages.
4. Build Living Documents, Not Pretty Pictures
Your journey map should be a spreadsheet that gets updated weekly, not a design file that remains static.
Track real metrics:
- Conversion rates at each micro-step
- Time spent at each touchpoint
- Exit points and their triggers
This data-driven approach aligns perfectly with building a strong B2B sales funnel that converts prospects at every stage.
5. Create Channel-Specific Journey Variants
For instance, a tech start-up recently transitioned to a completely digital sales process, resulting in a 30% increase in customer satisfaction by offering immediate access to pricing and product details, which these younger decision-makers prioritize.
Don’t build one journey map. Build journey variants for:
- Self-serve prospects (direct signups)
- Sales-assisted prospects (demo requests)
- Channel partner referrals
- Existing customer expansions
Each requires different touchpoints and messaging. This is particularly important when implementing account-based marketing funnel strategies that target different customer segments.
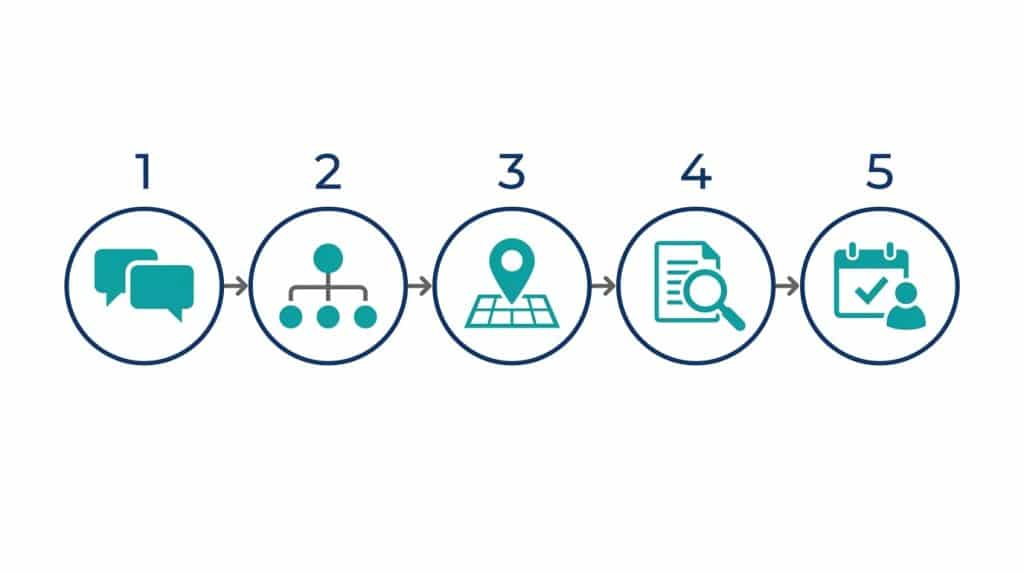
How to Build a Customer Journey Map by Revenue Stage: 5 Steps
Seven out of ten B2B companies that build journey maps never use them. The maps that do get used share a common structure: they are built from real customer data, scoped to a single revenue bracket, and owned by a named person. Here is the process.
- Choose one revenue bracket and stay there. Do not try to map the journey from $0 to $200M in a single session. Pick the bracket that matches your current ARR. Your buyers, decision-making structures, and critical touchpoints differ at each stage. A map that tries to cover all of them covers none of them well.
- Interview eight to twelve recent customers before touching a template. The most expensive journey-mapping mistake I see Series A founders make is building on internal assumptions. Ask customers: “Walk me through how you found us and decided to buy.” Record it. The words they use become the language of your map. Internal hypothesis maps miss 20 to 30% of what actually happens, and the missing pieces are usually the most critical.
- Map the buying committee, not a single persona. At $1M ARR, one person usually decides. At $10M ARR, three to five people are involved. This shift is most pronounced in B2B SaaS companies, where the product-led and sales-led motions create separate champion and buyer tracks simultaneously. At $50M ARR, you have a committee of eight to twelve. Your map must name each stakeholder role, what they care about (the CFO cares about ROI; the IT director cares about security; the end user cares about usability), and which touchpoints each one encounters independently.
- Include the touchpoints you do not control. Review sites, peer communities, analyst reports, AI-generated answers, these shape decisions at every revenue bracket, and most journey maps pretend they do not exist. At the $50M+ ARR stage, these uncontrolled touchpoints often carry more weight than your own website.
- Assign a named owner to every stage and set a review date. A journey map without ownership is a wall decoration. Assign one person to own each stage of the map. Set a calendar reminder to review the map quarterly. When your ARR doubles, the map needs a full rebuild; the buyer at your next revenue bracket is not the same person who bought from you at your last one.
“Only 34% of companies have a well-defined customer journey mapping strategy. The other 66% are guessing about their customer experience, and their conversion rates show it.”
Common Journey Mapping Mistakes That Kill ROI
Mistake #1: The Internal Process Trap
You’re mapping your sales process, not your customer’s buying process. This is why implementing effective sales enablement strategy requires understanding the customer’s perspective first.
Mistake #2: The Multi-Persona Muddle
Build separate maps for each core persona. A startup founder’s journey looks nothing like an enterprise procurement manager’s journey.
Mistake #3: The Post-Purchase Amnesia
Most journey maps end at purchase. The biggest revenue opportunities often start there.
Mistake #4: The Research-Free Fiction
Your assumptions about customer behavior are probably wrong. Base your maps on data, not opinions.
Mistake #5: The Action-Free Analysis
A journey map that doesn’t result in specific, measurable changes to your marketing and sales process is just expensive documentation.
How Do You Know If Your Journey Map Is Actually Working?
A journey map is working when conversion rates improve, sales cycles shorten, or churn drops in the 90 days after you change a specific touchpoint it identifies. If none of those metrics move, the map is not being used operationally.
Most companies never measure whether their customer journey analytics improve business outcomes.
Here’s how to track success through customer journey orchestration:
Leading Indicators:
- Conversion rates between journey stages
- Time to progress through the funnel
- Content engagement at each touchpoint
Lagging Indicators:
- Customer acquisition cost reduction
- Sales cycle compression
- Customer lifetime value increases
If your customer journey mapping methodology doesn’t move these metrics, you’re building wall art, not strategy. Effective journey-mapping ROI measurement requires tracking both customer experience strategy outcomes and revenue attribution modeling to demonstrate business impact.
The Technology Stack for Dynamic Journey Mapping
Forget expensive journey-mapping software that produces static visualizations.
Build your stack around:
- Analytics Tools: Google Analytics 4, Hotjar for behavior tracking
- CRM Integration: HubSpot or Salesforce for progression tracking
- Feedback Collection: Typeform or Calendly for customer interviews
- Content Management: Notion or Airtable for journey-content mapping
The best journey maps are living documents in spreadsheets, not pretty pictures in design tools. This tech stack approach supports the development of in-house agency capabilities for ongoing journey optimization.
What Separates Journey Maps That Drive Revenue From Ones That Gather Dust
Customer journey mapping isn’t about creating beautiful visualizations for your next board meeting.
It’s about understanding exactly how your customers buy so you can optimize every touchpoint for revenue.
With 89% of companies now competing solely on customer experience, the companies that build journey maps based on real customer data will dominate their markets.
Companies that build journey maps based on internal assumptions will continue to burn millions on projects that appear impressive but deliver nothing.
Which category will your company choose?
Frequently Asked Questions About Customer Journey Mapping
What is a customer journey map in B2B?
A B2B customer journey map documents every touchpoint a buyer has with your company, from initial awareness through post-sale advocacy. Unlike B2C mapping, B2B maps must account for multiple decision-makers, longer sales cycles, and committee buying dynamics. The most effective maps are revenue-stage specific: the touchpoints that matter at $2M ARR differ structurally from those at $20M ARR.
How do customer journey touchpoints change from $0–1M to $200M ARR?
At $0 to $1M ARR, most deals flow through a single decision-maker via peer referral with a fast proposal. At $1M to $10M ARR, a second stakeholder enters and case studies become the primary conversion tool. At $10M to $50M ARR, formal buying committees evaluate providers, making champion materials critical. At $50M to $200M ARR, analyst citations and proof-of-concept stages dominate the evaluation process.
What is the difference between a customer journey map and a sales funnel?
A sales funnel represents your internal sales process from the company’s perspective. A customer journey map represents the buyer’s experience, capturing emotional states, pain points, and decision triggers across the full lifecycle — including post-purchase stages like onboarding, expansion, and advocacy that most sales funnels ignore entirely.
How often should B2B companies update their customer journey maps?
B2B journey maps should be reviewed at least quarterly. Trigger an immediate update when buyer behavior shifts, a new competitor enters, or your company moves to a new revenue bracket. Since 67% of B2B buyers now complete more than half of their evaluation without speaking to a sales rep, maps built around sales-led motions become inaccurate within six months of creation.
What tools work best for B2B customer journey mapping?
For most B2B tech companies with ARR below $20M, a well-structured spreadsheet combined with CRM data and a lightweight feedback tool outperforms expensive journey-mapping software. Visual platforms like Miro or Lucidchart add value once you have a working data model. The tool matters far less than the quality of the customer conversations that feed it.
What are the stages of a B2B customer journey?
A B2B customer journey covers five stages: Awareness (the buyer identifies a problem), Evaluation (they research and compare solutions), Decision (they select a vendor), Onboarding (they implement the solution), and Expansion (they deepen the relationship or renew). Unlike B2C journeys, B2B journeys are non-linear and involve multiple stakeholders moving through different stages simultaneously.
How many touchpoints are in a B2B customer journey?
B2B customer journey touchpoints range from 15 to 266 per deal, depending on deal size and measurement methodology. Sub-$50K annual deals typically involve 30 to 50 touchpoints. Enterprise deals above $500K can involve more than 100 tracked interactions across a buying committee that was never fully mapped.
Is Your Journey Map Built for Your Current Revenue Stage?
Most journey maps fail not because they are inaccurate but because they are built for the wrong company. Use this checklist to check whether your map reflects where you actually are.
$0–1M ARR, Does your map reflect these realities?
- Peer referral is mapped as the primary awareness channel, not paid or organic
- The evaluation stage consists of one conversation and one proposal, not a multi-step process
- The map ends at first deliverable quality, not at 90-day renewal
- A single decision maker is the entire buying committee. No formal evaluation process exists at this stage.
$1M–$10M ARR, Does your map reflect these realities?
- A case study is mapped as a required evaluation asset, not a nice-to-have
- An internal champion is identified as a distinct stakeholder, separate from the economic buyer
- Sales materials are designed to be shared internally, not just presented in meetings
- The 90-day check-in is mapped as the primary churn-prevention touchpoint
$10M–$50M ARR, Does your map reflect these realities?
- The champion’s journey and the economic buyer’s journey are mapped as two separate paths
- Reference calls are mapped as a formal evaluation stage, not an afterthought
- The expansion conversation is mapped at the 6-month mark, not at renewal
- QBRs are mapped as pipeline-generating events, not just retention activities
$50M–$200M ARR, Does your map reflect these realities?
- Third-party validation (analyst reports, AI citations) is mapped as an awareness touchpoint
- The proof-of-concept is mapped as the primary evaluation stage, not demos or case studies
- Executive-level relationships are mapped at two or more C-suite levels
- The Annual Business Review is mapped as an expansion trigger, not a retention check-in
If you answered no to two or more items in your current bracket, your journey map is describing a company at a different revenue stage than the one you are operating in.
The Bottom Line: Build for the Revenue Stage You Are In
The companies that get the most from journey mapping are not the ones with the most sophisticated tools. They are the ones that build maps specific to their current revenue bracket, assign named owners to each stage, and update the map when their buyers change, not when their strategy team schedules a review.
If your current journey map was built before your last funding round, it likely describes a company that no longer exists.
Start with the revenue bracket framework above. Pick the stage that matches where you are today. Map the four or five touchpoints that actually move deals at that stage. That is more useful than a 47-slide deck built from assumptions.
For B2B tech founders who want their content to work as a journey stage on its own, the educational email course approach is worth understanding. Content that teaches buyers what they need to know before they are ready to buy does the same work as a well-staffed sales motion, at a fraction of the cost.
Putting It Into Practice
The companies that get the most from journey mapping are not the ones with the most sophisticated tools. They are the ones that build maps specific to their current revenue bracket, assign named owners to each stage, and update the map when their buyers change.
If your current journey map was built before your last funding round, it likely describes a company that no longer exists.
Start with the revenue bracket framework above. Pick the stage that matches where you are today. Map the four or five touchpoints that actually move deals at that stage. That is more useful than a 47-slide deck built from assumptions.
For B2B tech founders who want their content to do the same work as a well-staffed sales motion, the educational email course approach is worth understanding: content that teaches buyers what they need to know, before they are ready to buy, maps directly onto the evaluation stage at every revenue bracket.
