Most B2B executives are tracking the wrong team productivity metrics.
They’re obsessing over hours logged and tasks completed, while their businesses hemorrhage money due to strategic misalignment and organizational confusion.
Here’s the reality: Only 7% of employees fully understand their company’s business strategies. Meanwhile, 85% of leadership teams spend less than one hour per month discussing strategy with their teams.
These aren’t productivity problems. They are measurement problems.
What Are Team Productivity Metrics?
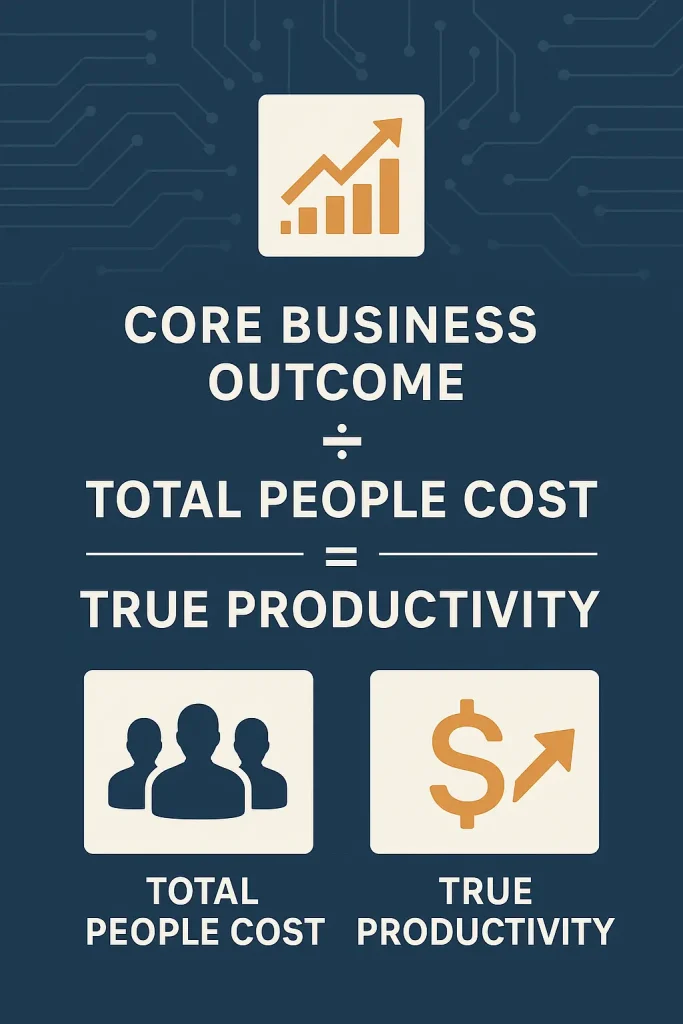
Team productivity metrics are quantifiable measures that connect employee activities directly to business outcomes, calculated as:
Core Business Outcome ÷ Total People Cost.
Unlike traditional HR metrics that track activity, strategic productivity metrics measure actual business impact and ROI from human capital investment.
Table of Contents
The $50,000 Category Error Every CEO Makes
Fifteen years ago, companies made a critical mistake with IT departments.
They treated software engineering like a cost center for “keeping servers running” instead of recognizing it as an innovation engine driving business growth.
Today, B2B leaders make the same category error with team productivity metrics.
They treat team management like an HR compliance function instead of recognizing it as strategic business optimization.
At a digital agency I worked with, this confusion cost them $50,000 in management overhead annually. They were measuring employee productivity through traditional HR metrics while their actual business productivity plummeted due to goal misalignment.
This mirrors the same brand credibility challenges many B2B companies face when they focus on surface-level metrics instead of building genuine authority.
The fix? A straightforward formula that changed everything.
The Expert Behind the Framework
These insights come from Projjal Ghatak, CEO and founder of OnLoop, who has spent his career optimizing human capital ROI at scale.

His background spans strategy roles at Uber (where he managed 50+ person teams during the company’s growth from 9,000 to 27,000 employees), Accenture strategy consulting across Southeast Asia, and Stanford Business School.
At Uber, Projjal witnessed firsthand the massive gap between business school best practices and industry reality. He saw technology transform project management, video conferencing, and coding—but when it came to team productivity, organizations were still stuck with form-filling exercises that “everybody hated.”
This experience led him to create Collaborative Team Development (CTD), an alternative to traditional performance management approaches, such as OKRs.
His methodology now helps companies with 200-500 employees achieve measurable productivity improvements while cutting management overhead.
Watch the Full Interview: Team Productivity Insights from OnLoop’s CEO
For the complete conversation with Projjal Ghatak covering the five-layer productivity framework, energy management strategies, and real-world implementation case studies, watch the full episode below:
Prefer to listen on the go? Find this episode on your favorite podcast platform or continue reading for the key insights and actionable takeaways.
The Only Team Productivity Metric That Matters for ROI
Here’s the metric that separates high-performance organizations from productivity theater:
Core Business Outcome ÷ Total People Cost = True Productivity
This isn’t about counting tasks or measuring screen time.
It’s about connecting human capital investment directly to business results.
Why Traditional Productivity Metrics Fail
Most team productivity measurement tools focus on:
- Hours worked
- Tasks completed
- Email response times
- Meeting attendance rates
These metrics tell you nothing about strategic impact.
Case study from my SaaS consulting work: A 200-person company tracked 47 different employee productivity metrics. Their dashboard looked impressive. Their revenue per employee ranked in the bottom quartile of their industry.
The problem? They measured activity instead of outcomes.
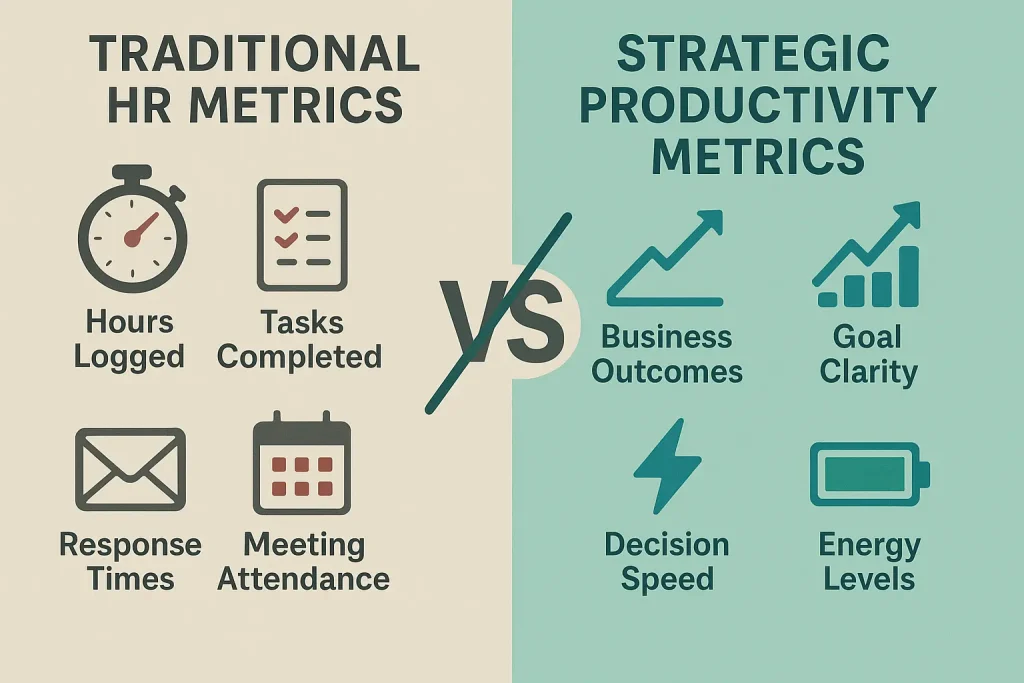
Traditional vs. Strategic Productivity Metrics Comparison
| Traditional HR Metrics | Strategic Productivity Metrics |
|---|---|
| Hours logged per day | Core business outcome ÷ total people cost |
| Tasks completed | Goal alignment clarity score |
| Email response times | Strategic initiative progress |
| Meeting attendance | Decision-making speed |
| Time tracking accuracy | Energy/motivation levels |
| Process compliance | Cross-functional collaboration effectiveness |
The Five-Layer Productivity Framework That Works
Based on research from OnLoop’s Collaborative Team Development methodology, effective team productivity metrics follow a hierarchical structure.
This approach mirrors successful demand generation strategies where you must first understand your audience’s awareness level before delivering the right message.

The Five-Layer Productivity Framework Breakdown
| Layer | Category | Focus Area | Key Metric | When to Address |
|---|---|---|---|---|
| 1 | Foundation | Energy & Motivation | Battery Level (20-100%) | Always first |
| 2 | Foundation | Goal Alignment | Strategic Clarity Score | Before performance feedback |
| 3 | Sustaining | Strengths-Based Feedback | Superpower Tags | High performers only |
| 4 | Sustaining | Improvement Feedback | Blind Spot Identification | After foundations are solid |
| 5 | Sustaining | Continuous Learning | Growth & Development | Top layer priority |
Layer 1: Energy and Motivation Tracking
Replace wellness surveys with simple “battery checks.”
Ask team members: “How full is your battery today? 100%, 80%, 60%, 40%, 20%?”
This removes the stigma from energy discussions and provides managers with actionable data.
Someone operating at 40% shouldn’t tackle complex strategic work that day. Give them routine tasks instead.
Layer 2: Goal Alignment Clarity
Test alignment with this diagnostic: “If you had to stop working on one project to focus on company priorities, which would you drop and why?”
Clear goal alignment means immediate answers that connect to actual business metrics.
The shocking truth: 95% of employees don’t understand their company strategy in the first place.
This is similar to how most businesses approach customer awareness stages – they assume their audience knows more than they actually do.
Layer 3: Strengths-Based Feedback
Traditional performance reviews focus on weaknesses.
High-productivity teams identify and leverage individual superpowers instead.
Color-code team members’ strengths across five categories:
- Red: Execution capabilities
- Blue: Intellectual thinking
- Orange: Leadership influence
- Yellow: Team orientation
- Green: Growth mindset
Layer 4: Improvement-Based Development
Reserve constructive feedback for high performers who’ve mastered the foundational layers.
Low performers need energy and clarity fixes, not more criticism.
Layer 5: Continuous Learning Integration
AI-powered coaching works here, but only after establishing strong clarity in the bottom four layers.
Tool Fatigue Is Killing Your Productivity Metrics
B2B executives are drowning in productivity measurement software that nobody uses.
Sound familiar? You’ve purchased team performance tracking tools that became expensive shelfware within 30 days.
The solution isn’t another dashboard. It’s tech-enabled services that combine human expertise with measurement technology.
This is exactly why successful businesses focus on crafting compelling content that resonates rather than just producing more generic material.
From Software-Only to Strategic Partnership
Software-only approach: “Here’s the platform, figure it out.”
Strategic partnership: “We’ll implement the system, train your managers, analyze your data monthly, and adjust based on what works in your specific culture.”
Companies that utilize strategic partnerships experience 25-40% improvements in their core business outcomes per person cost ratio.
Software-only implementations typically fail within six months.
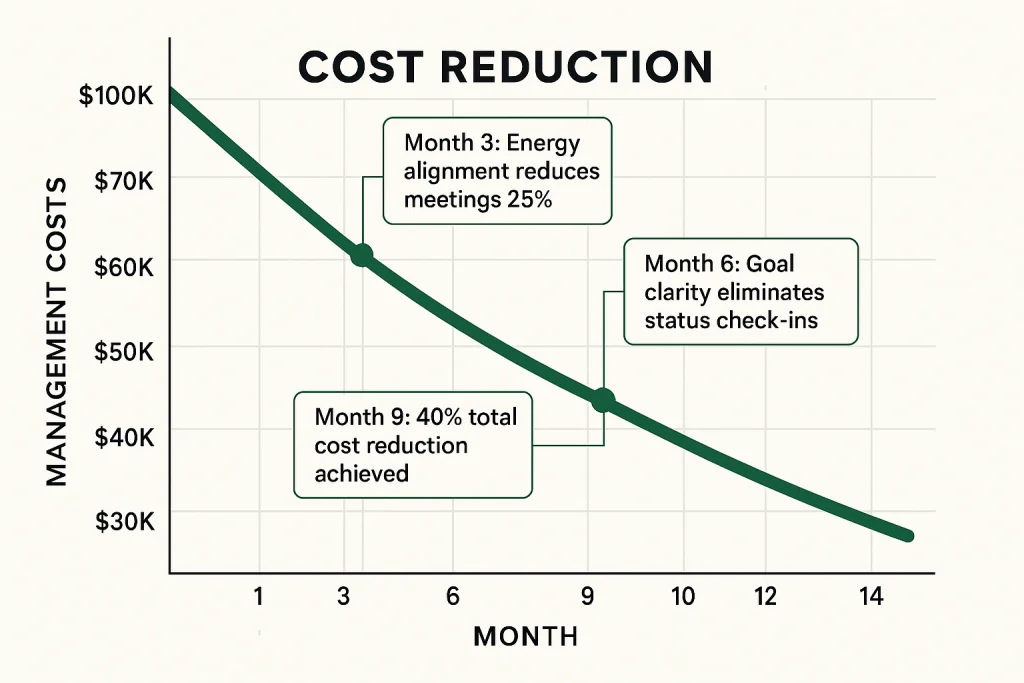
The Management Cost Revolution
Here’s how the right team productivity metrics cut management costs by 40%:
Reduced Management Overhead
Clear goal alignment eliminates the need for constant status meetings and micro-management.
Managers spend less time explaining priorities and more time removing obstacles.
Faster Decision Making
When employees clearly understand the strategy, they can make faster decisions about priorities and resource allocation.
No more waiting for approval on every choice.
Decreased Turnover Costs
High performers stay when they understand their superpowers and growth trajectory.
Low performers improve when energy and clarity issues are addressed first.
Eliminated Productivity Paranoia
Remote work anxiety disappears when leaders can see actual business impact instead of guessing based on activity metrics.
The Battery Check That Changed Everything
At a 300-person insurtech company where Projjal consulted, implementing daily “battery checks” transformed their team’s productivity metrics.
Before: Managers assumed performance issues were skill-related and piled on more training and feedback.
After: They discovered 60% of performance problems stemmed from energy levels below 60%.
Result: 40% reduction in management intervention costs and 25% improvement in project completion rates.

The key insight? Performance that fluctuates dramatically typically indicates energy issues, rather than skill gaps.
Consistent underperformance suggests skill problems. Sporadic issues indicate gaps in motivation and clarity.
This approach mirrors the principle behind effective B2B landing pages – you must first understand where your audience is before you can guide them to action.
Why Your Current Metrics Are Measuring the Wrong Thing
Traditional team productivity measurement focuses on:
- Individual task completion
- Time tracking accuracy
- Process compliance rates
Strategic productivity metrics track:
- Goal-to-outcome alignment
- Decision-making speed
- Strategic initiative progress
- Cross-functional collaboration effectiveness
The difference? One measures busy work. The other measures business impact.
The Weekly Cadence That Drives Results
High-performance teams that utilize effective productivity metrics operate on a weekly basis, rather than relying on annual reviews.
Weekly manager-team member conversations should cover:
- Current battery level assessment
- Goal clarity confirmation
- Obstacle identification
- Strength utilization opportunities
- Learning and growth progress
This enables real-time course correction, rather than year-end surprises.
Research shows that consistent measurement and adjustment cycles significantly outperform sporadic check-ins for driving business outcomes.
Implementation Strategy for B2B Leaders
Month 1: Establish the Foundation
Start with your highest-performing managers.
Implement battery checks and goal alignment diagnostics.
Measure baseline: current core business outcome divided by total people cost.
Month 2: Address Energy and Clarity
Focus exclusively on the bottom two layers.
Don’t initiate performance improvement conversations until energy levels consistently reach 80% or higher and goal alignment is clear.
Month 3: Expand and Optimize
Roll out to additional teams based on initial results.
Begin strengths-based feedback for high performers only.
Track your productivity ratio monthly for trending data.

The Content Strategy Connection
Effective team productivity metrics lead to improved content and marketing outcomes.
When teams understand strategic priorities, they produce more aligned content that drives business results.
This matters for B2B tech leaders who need consistent, high-quality thought leadership content that builds authority and drives lead generation.
Companies with clear goal alignment produce 40% more strategic content pieces that directly support sales objectives.
Just like successful content creators who understand their audience’s needs, high-performing teams align their daily work with strategic business outcomes.
The Future of Team Productivity Measurement
AI will handle routine productivity tracking, but human insight remains critical for strategic alignment.
The winning combination: automated data collection with human-led strategic interpretation.
Industry research indicates that companies combining technology with human expertise consistently outperform those using either approach alone.
B2B leaders who strike this balance now will have a significant competitive advantage as AI tools become commoditized.
Key Statistics & Research Findings
Team Productivity Crisis by the Numbers
- 7% – Employees who fully understand their company’s business strategies (OnLoop Research)
- 95% – Employees who don’t understand their company strategy at all (ClickUp Study)
- 85% – Leadership teams spending less than one hour monthly on strategy discussions (ActivTrak Research)
- 40% – Management cost reduction achieved through strategic productivity metrics
- 25-40% – Productivity improvements seen by companies using strategic partnerships vs. software-only approaches
- 60% – Performance problems stemming from energy levels below 60% (Case study data)
- 47 – Different productivity metrics tracked by one 200-person company (with bottom-quartile results)
Expert Insights & Quotes from Projjal Ghatak
“The gap between how important managing teams effectively is for organizations to run well, and the quality of tooling and processes that I witnessed became most palpable at Uber.”
“If you can’t measure it, you can’t change it. And ultimately it boils down to some measure of business success that matters the most for the business divided by the total cost of your people.”
“We tell managers that typically if there’s a low performer on your team, we guarantee you the problem is at those two foundational layers [energy and goal clarity]. Doing things like giving people improved feedback is not going to help them.”
“Just bringing awareness to the fact that someone’s battery is at 40% is like 65% of the battle done.”
“There is more a productivity paranoia problem than a true productivity problem. And we can solve both through the right approaches.”
Implementation Timeline & Checklist
| Month | Focus Area | Key Actions | Success Metrics |
|---|---|---|---|
| 1 | Foundation Setup | Battery checks, goal diagnostics, baseline measurement | 80%+ team participation, baseline ROI established |
| 2 | Energy & Clarity | Address foundational issues only | Energy levels 80%+, clear goal alignment |
| 3 | Expand & Optimize | Roll out to additional teams, add strengths feedback | Measurable productivity ratio improvement |
Frequently Asked Questions
What are the most important team productivity metrics to track?
The most critical metric is Core Business Outcome ÷ Total People Cost. This connects human capital investment directly to business results. Support this with energy levels (battery checks), clarity of goal alignment, and progress on strategic initiatives, rather than traditional activity metrics like hours logged or tasks completed.
How do you measure team productivity ROI?
Calculate your primary business metric (revenue, users, profit) divided by total people costs (salaries, benefits, equipment, overhead). Track this monthly for trends. Companies that achieve a 15-25% year-over-year improvement in this ratio typically have effective productivity management.
What’s the difference between HR metrics and productivity metrics?
HR metrics focus on compliance and administration (attendance, review completion, policy adherence). Productivity metrics measure business impact and strategic alignment (goal clarity, energy levels, outcome achievement). HR is administrative; productivity management is strategic.
How often should you measure team productivity?
Weekly touchpoints for energy and goal alignment, monthly tracking of the core productivity ratio, and quarterly deep dives for strategic adjustments. Avoid daily micromanagement or annual-only reviews—both extremes reduce effectiveness.
Why do traditional productivity tools fail?
Most tools were initially built for organizational reporting and later adapted for individual use. They measure activity instead of outcomes, creating “checkbox” compliance rather than strategic alignment. Success requires tech-enabled services, not software-only solutions.
What is the “battery check” methodology?
A simple daily question: “How full is your battery today? 100%, 80%, 60%, 40%, 20%?” This removes the stigma from energy discussions and helps managers make more informed task assignments. Someone at 40% should focus on routine work, not complex strategic projects.
How long does it take to see results from better productivity metrics?
Foundational improvements (energy and goal clarity) show results in 2-4 weeks. Measurable business impact typically appears within 90 days. Full transformation takes 6-12 months with consistent weekly implementation.
Key Takeaways
For Immediate Implementation:
- Replace activity tracking with outcome measurement using Core Business Outcome ÷ Total People Cost
- Implement weekly “battery checks” to assess team energy levels before assigning complex work
- Test goal alignment with the diagnostic: “Which project would you drop to focus on company priorities?”
- Address energy and clarity issues before attempting performance improvement conversations
For Strategic Planning:
- Treat team management as business optimization, not HR compliance
- Invest in tech-enabled services rather than software-only productivity solutions
- Focus on weekly cadences for productivity discussions, not annual reviews
- Measure decision-making speed and strategic initiative progress over task completion rates
For Long-term Success:
- Build goal alignment from individual work up to organizational strategy (bottom-up approach)
- Use strengths-based feedback for high performers, and energy management for underperformers
- Create real-time course correction capabilities through consistent measurement
- Prepare for AI-assisted productivity tracking combined with human strategic insight
Glossary of Terms
Battery Check: A daily energy assessment using smartphone battery metaphor (100%, 80%, 60%, 40%, 20%) to remove stigma from discussing motivation and capacity levels.
Collaborative Team Development (CTD): OnLoop’s methodology for managing goals and feedback in teams, using a five-layer hierarchical structure instead of traditional performance management approaches.
Core Business Outcome: The primary metric that matters most for your specific business—revenue, profit, users, or other key performance indicators tied directly to strategic success.
Goal Alignment Diagnostics: Tests to determine if team members understand how their daily work connects to company strategy, measured through specific scenario-based questions.
Productivity Paranoia: The anxiety leaders feel about remote team performance when they lack visibility into actual business impact, often leading to micromanagement or return-to-office mandates.
Strategic Partnership Model: Tech-enabled services that combine software tools with human expertise, implementation support, and ongoing optimization rather than software-only approaches.
Tech-Enabled Services: Solutions combining technology platforms with human strategic guidance, training, and ongoing optimization rather than self-service software tools.
Total People Cost: Complete cost of human capital, including salaries, benefits, equipment, office space, training, management overhead, and recruitment/replacement expenses.
Your Next Steps
Stop measuring activity. Start measuring impact.
Replace your current team productivity metrics with outcome-focused alternatives.
Test the core business outcome ÷ total people cost formula for 90 days.
Focus on energy levels and goal alignment before attempting to improve performance.
Consider tech-enabled services instead of software-only solutions.
If you need strategic guidance on implementing these frameworks, get in touch to explore how content strategy can support your team alignment initiatives.
The Bottom Line
Team productivity metrics that focus on strategic alignment and energy management cut management costs by 40% while improving actual business outcomes.
The companies that first optimize human capital will dominate their markets.
Your competitors are still counting hours and tasks, while you could be optimizing for revenue per employee and achieving strategic goals.
The question isn’t whether you can afford to change your approach.
It’s whether you can afford not to.
Just like a successful website revamp requires understanding your current performance before making improvements, transforming your team productivity measurement starts with an honest assessment of what you’re actually tracking today.
About the Author: I help B2B tech startups from seed to Series C develop content strategies that drive revenue growth. My ghostwriting services for educational email courses and LinkedIn content help executives communicate their expertise while building authority in their markets. Learn more about strategic content development.
Some areas we explore in this episode include:
Listen to the episode.
Related links and resources
- Check out OnLoop
- Learn from Ryan Yackel – Save $1M+ Annually With This Data Observability Hack (And Stop Wasting Resources on Preventable Data Issues.)
- Learn from Ian Harris – How a First Principles Approach Simplifies Growth: Revenue Breakthroughs Made Easy
- Learn from Pete Steege – Small Tests, Big Wins: Iterative Agile Marketing Secrets Revealed
- Check out the article – 4 Key Strategies for Driving B2B Sales Growth in 2025
- Check out the article – Real Time Marketing: How to Make the Most of Every Moment
Connect with Projjal Ghatak
Subscribe to & Review the Predictable B2B Success Podcast
Thanks for tuning into this week’s Predictable B2B Podcast episode! If the information in our interviews has helped your business journey, please head over to Apple Podcasts, subscribe to the show, and leave us an honest review.
Your reviews and feedback will not only help me continue to deliver great, helpful content but also help me reach even more amazing founders and executives like you!
